
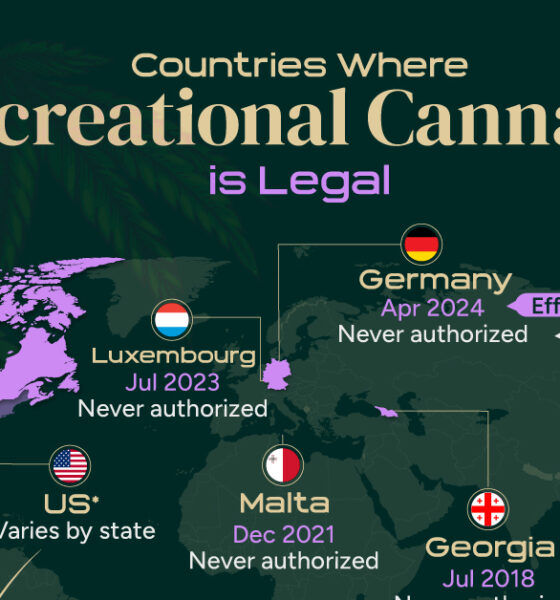
In total, only nine countries have fully legalized recreational cannabis use.
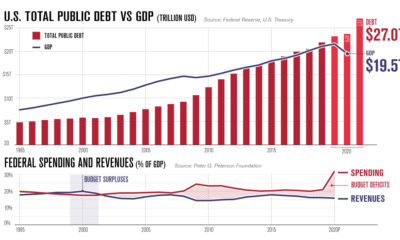

America's debt recently surpassed $27 trillion. In this infographic, we peel back the layers to understand why it keeps on growing.
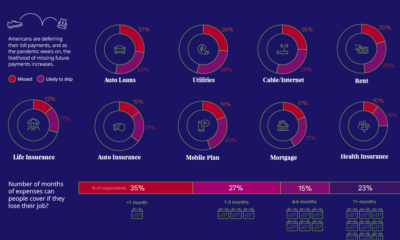

57% of U.S. consumers' incomes have taken a hit during the pandemic. How do such financial anxieties affect the ability to pay bills on time?
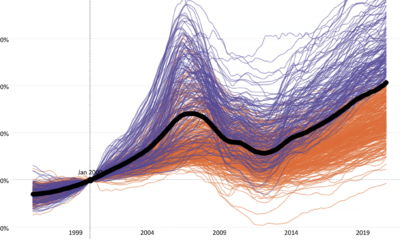

This interactive visualization tracks two decades of home price changes in hundreds of cities in the United States.
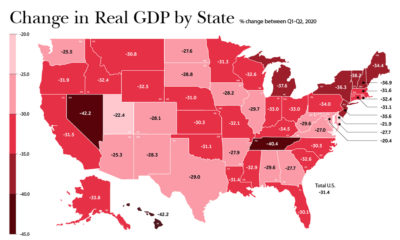

In just a few months, the U.S. economy reeled from COVID-19. As real change in GDP suffered, which states and industries were the hardest-hit?
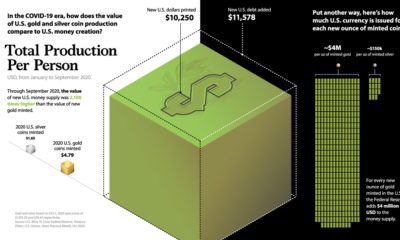

Amid trillions in COVID-19 stimulus, this graphic compares new U.S. dollars printed to U.S. precious metal coin production.


The Dow Jones Industrial Average is constantly evolving. This chart tracks which companies have come and gone since the inception of the index in 1928.
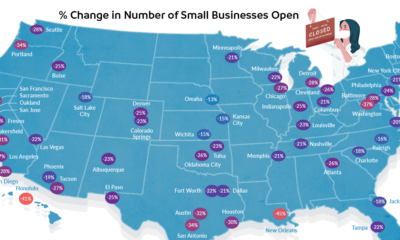

Across the U.S., 37% of small businesses are still shuttered. This map demonstrates how uneven that closure rate is in cities around the country.
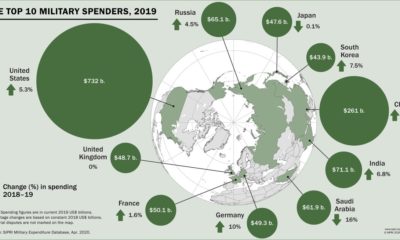

Global military spending surpassed $1.9 trillion in 2019, but nearly 75% of this total can be traced to just 10 countries.
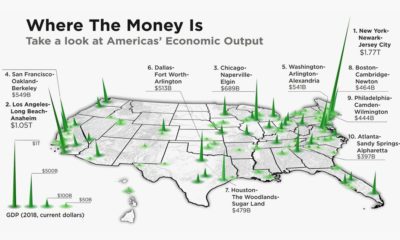

The total U.S. GDP stands at a whopping $21 trillion, but which metro areas contribute to the most in terms of economic output?
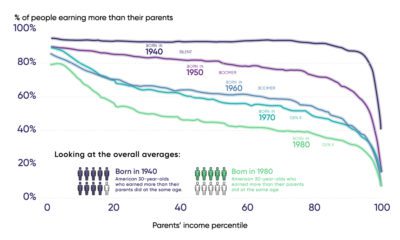

Each generation of Americans has historically earned more than their parents, but declining upward mobility is putting this growth at risk.


