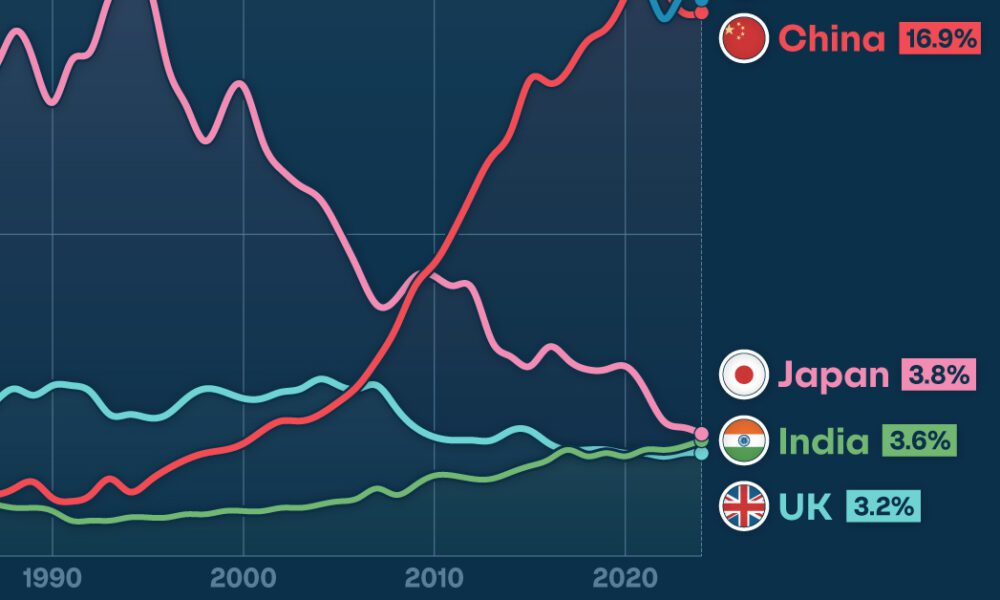

Gain a unique perspective on the world's economic order from this graphic showing % share of global GDP over time.
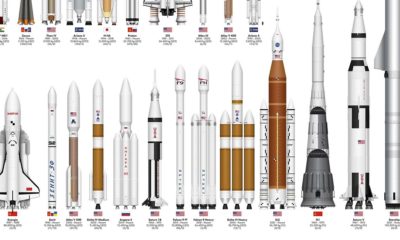

This infographic sizes up different rockets used to explore space, from the USSR's Soyuz to the SpaceX Starship.
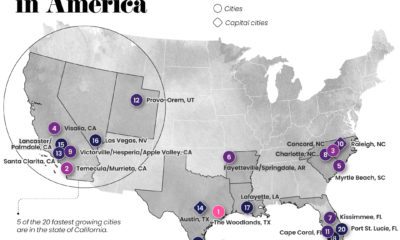

Which U.S. cities are growing the fastest? Here are the 20 fastest growing cities in the U.S., based on projected population growth to 2025.
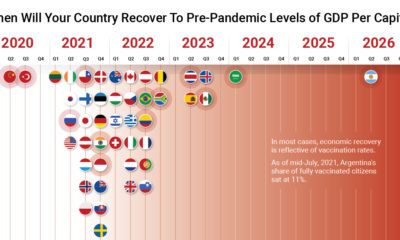

The path to COVID-19 recovery varies worldwide—some countries have already recovered, while others will not be back to normal for years.
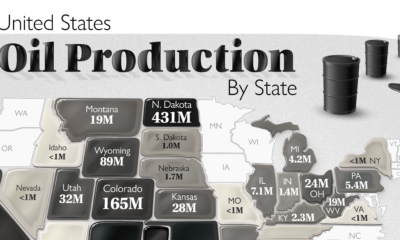

The U.S. is the largest oil producer in the world. Here we map the share of oil production in the country by all 50 states in...
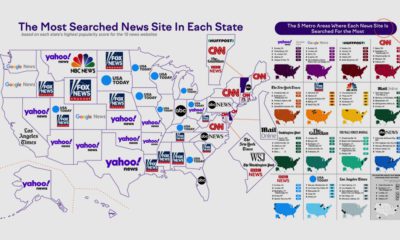

American states have some key differences for their favorite news sites. Here's how they rank by monthly visitors and state popularity.
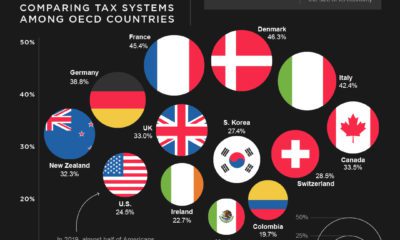

Using the tax-to-GDP ratio, we compare the tax systems of 35 OECD countries. See which nations have the highest and lowest rates.
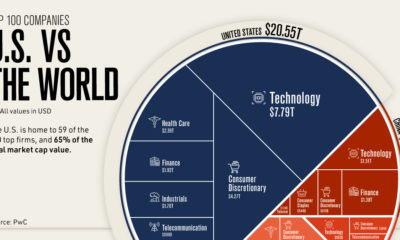

Where are the top 100 companies of the world located? We highlight the U.S. share of the top companies by market capitalization .
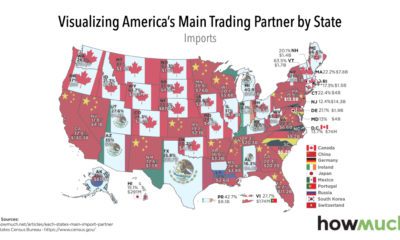

At the national level, Canada and China are top U.S. trading partners. While this generally extends to the state level, there are some surprises too.
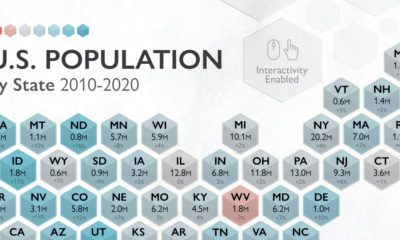

The U.S. saw 7.4% population growth in the past decade, the lowest it's been since the 1930s. How does population by state look today?


There are over 18 million living veterans in the U.S., but how many are ultra wealthy? This visual ranks the richest veterans in America.


