Mining
How Canada’s Mining Sector Impacts the Economy
Canada is a mining nation.
From the Rockies to the Canadian Shield, and from the Plains and to the North, the variety of geology that exists in the country is immense – and this has created a large and unique opportunity for groundbreaking mineral discoveries.
As a result, Canada is one of the world’s largest exporters of minerals and metals, supplying approximately 60 different mineral commodities to over 100 countries.
An Intro to Canadian Mining
Today’s infographic comes to us from Canadian Minerals and Metals Plan and it highlights an industry that has given Canada a competitive advantage in the global economy.

The mineral sector brings jobs, investment, and business to Canada.
This impact stems from the whole lifecycle of mining, including exploration, extraction, primary processing, design, and manufacturing processes.
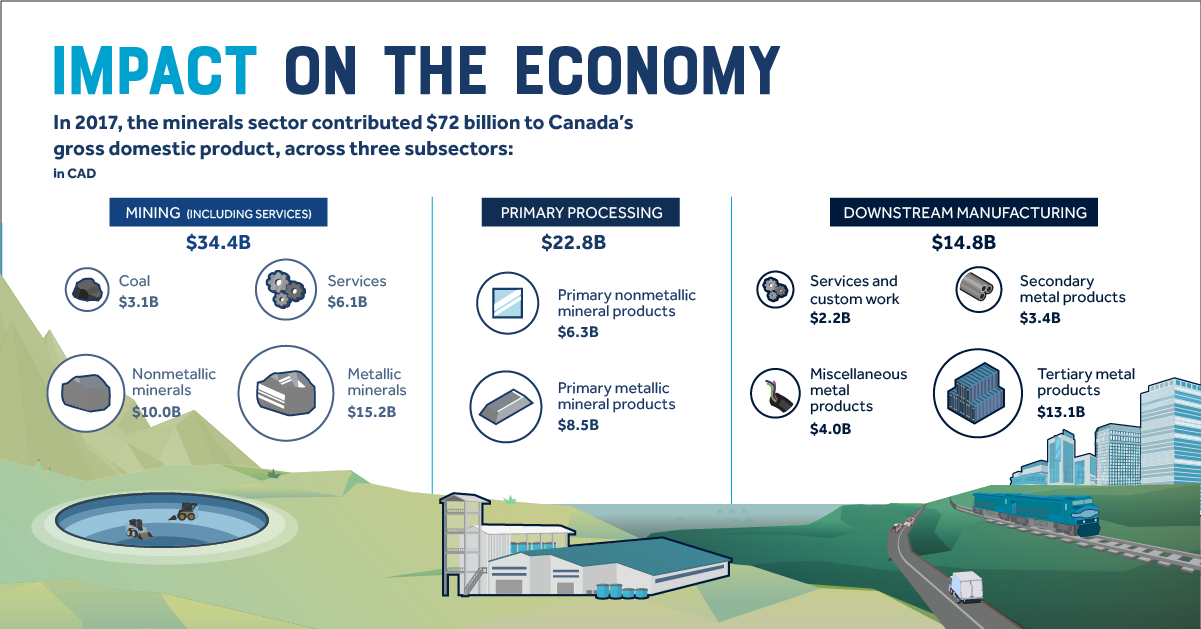
Economic Impact
Last year, the minerals sector contributed $72 billion to Canada’s GDP.
Here are the major minerals produced in Canada in 2017, along with their dollar value:
| Rank | Mineral | Value (2017) | Production (2017) |
|---|---|---|---|
| #1 | Gold | $8,700,000,000 | 164,313 kg |
| #2 | Coal | $6,200,000,000 | 59,893,000 tonnes |
| #3 | Copper | $4,700,000,000 | 584,000 tonnes |
| #4 | Potash | $4,600,000,000 | 12,214,000 tonnes |
| #5 | Iron Ore | $3,800,000,000 | 49,009,000 tonnes |
| #6 | Nickel | $2,700,000,000 | 201,000 tonnes |
| #7 | Diamonds | $2,600,000,000 | 22,724,000 karats |
According to S&P Global Market Intelligence, more non-ferrous mineral exploration dollars come to Canada than to any other country. In 2017, roughly $1.1 billion – or about 14% of global exploration spending – was allocated to Canada, which edged out Australia for the top spot globally.
Mining and Communities
From mining in remote communities to the legal and financial activities in urban centers such as Vancouver or Toronto, mining touches all Canadian communities.
According to a study commissioned by the Ontario Mining Association, the economic impact of one new gold mine in Ontario can create ~4,000 jobs during construction and production, and can contribute $38 to $43 million to the economy once operating.
Further, more than 16,500 Indigenous peoples were employed in the mineral sector in 2016, accounting for 11.6% of the mining industry labor force, making it the second largest private sector employee.
Innovation Drives Canadian Mining
Canada has an established network of academic thinkers, business associations, financial capital, and government programs that support and promote new technologies that can help set a standard for mining worldwide.
Here are a few examples of innovation at work:
- CanmetMINING is currently researching the implementation of hydrogen power to replace the use of diesel fuel in operating underground mines. Once this technology adopted, it could reduce the GHG emission footprint of underground mines by 25% and improve the health of workers in mines by reducing their exposure to diesel exhaust.
- New technology is turning what was once mine waste into a potential source for minerals. In the past three decades, six billion tonnes of mine tailings have accumulated with a potential value of US$10 billion. Reprocessing this waste can produce significant recoveries of rare earth elements, gold, nickel, cobalt and other valuable minerals.
- Artificial intelligence and new remote-control technology can be deployed to operate mining equipment and find new discoveries.
All these innovations are going to change the nature of working in mines, while creating high-paid jobs and demand for an educated labor force.
Opportunity for Future Generations
A large number of Canadian miners are expected to retire over the next decade. In fact, Canada’s Mining Industry Human Resources Council (MiHR) forecasts 87,830 workers at a minimum will have to be hired over the next ten years.
With game-changing technologies on the horizon, there will be plenty of opportunities for a new generation of high-tech miners. The future bodes well for Canadian mining.


Lithium
Ranked: The Top 10 EV Battery Manufacturers in 2023
Asia dominates this ranking of the world’s largest EV battery manufacturers in 2023.


The Top 10 EV Battery Manufacturers in 2023
This was originally posted on our Voronoi app. Download the app for free on iOS or Android and discover incredible data-driven charts from a variety of trusted sources.
Despite efforts from the U.S. and EU to secure local domestic supply, all major EV battery manufacturers remain based in Asia.
In this graphic we rank the top 10 EV battery manufacturers by total battery deployment (measured in megawatt-hours) in 2023. The data is from EV Volumes.
Chinese Dominance
Contemporary Amperex Technology Co. Limited (CATL) has swiftly risen in less than a decade to claim the title of the largest global battery group.
The Chinese company now has a 34% share of the market and supplies batteries to a range of made-in-China vehicles, including the Tesla Model Y, SAIC’s MG4/Mulan, and various Li Auto models.
| Company | Country | 2023 Production (megawatt-hour) | Share of Total Production |
|---|---|---|---|
| CATL | 🇨🇳 China | 242,700 | 34% |
| BYD | 🇨🇳 China | 115,917 | 16% |
| LG Energy Solution | 🇰🇷 Korea | 108,487 | 15% |
| Panasonic | 🇯🇵 Japan | 56,560 | 8% |
| SK On | 🇰🇷 Korea | 40,711 | 6% |
| Samsung SDI | 🇰🇷 Korea | 35,703 | 5% |
| CALB | 🇨🇳 China | 23,493 | 3% |
| Farasis Energy | 🇨🇳 China | 16,527 | 2% |
| Envision AESC | 🇨🇳 China | 8,342 | 1% |
| Sunwoda | 🇨🇳 China | 6,979 | 1% |
| Other | - | 56,040 | 8% |
In 2023, BYD surpassed LG Energy Solution to claim second place. This was driven by demand from its own models and growth in third-party deals, including providing batteries for the made-in-Germany Tesla Model Y, Toyota bZ3, Changan UNI-V, Venucia V-Online, as well as several Haval and FAW models.
The top three battery makers (CATL, BYD, LG) collectively account for two-thirds (66%) of total battery deployment.
Once a leader in the EV battery business, Panasonic now holds the fourth position with an 8% market share, down from 9% last year. With its main client, Tesla, now sourcing batteries from multiple suppliers, the Japanese battery maker seems to be losing its competitive edge in the industry.
Overall, the global EV battery market size is projected to grow from $49 billion in 2022 to $98 billion by 2029, according to Fortune Business Insights.

-

 Science1 week ago
Visualizing the Average Lifespans of Mammals
-

 Demographics2 weeks ago
The Smallest Gender Wage Gaps in OECD Countries
-

 United States2 weeks ago
Where U.S. Inflation Hit the Hardest in March 2024
-

 Green2 weeks ago
Top Countries By Forest Growth Since 2001
-

 United States2 weeks ago
Ranked: The Largest U.S. Corporations by Number of Employees
-

 Maps2 weeks ago
The Largest Earthquakes in the New York Area (1970-2024)
-

 Green2 weeks ago
Ranked: The Countries With the Most Air Pollution in 2023
-

 Green2 weeks ago
Ranking the Top 15 Countries by Carbon Tax Revenue