Markets
Black Swan Events: Short-term Crisis, Long-term Opportunity
This Markets in a Minute chart is available as a poster.
This Markets in a Minute chart is available as a poster.
Black Swans: Short-term Crisis, Long-term Opportunity
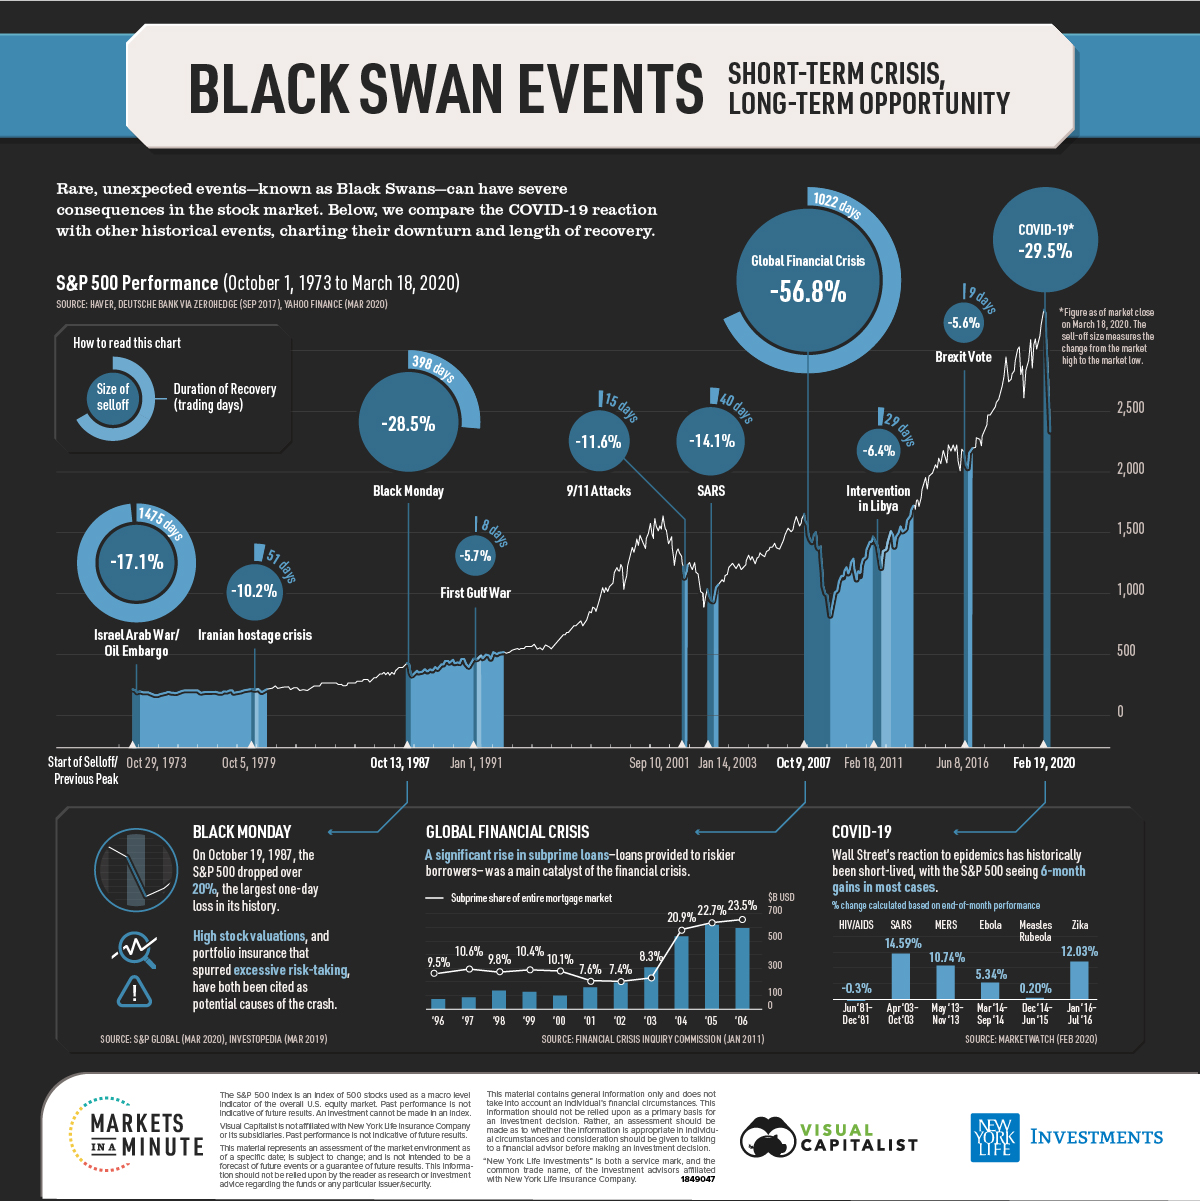
Few investors could have predicted that a viral outbreak would end the longest-running bull market in U.S. history. Now, the COVID-19 pandemic has pushed stocks far into bear market territory. From its peak on February 19th, the S&P 500 has fallen almost 30%.
While this volatility can cause investors to panic, it’s helpful to keep a long-term perspective. Black swan events, which are defined as rare and unexpected events with severe consequences, have come and gone throughout history.
In today’s Markets in a Minute chart from New York Life Investments, we explore the sell-off size and recovery length for some of these events.
Wars, Viruses, and Excessive Valuations
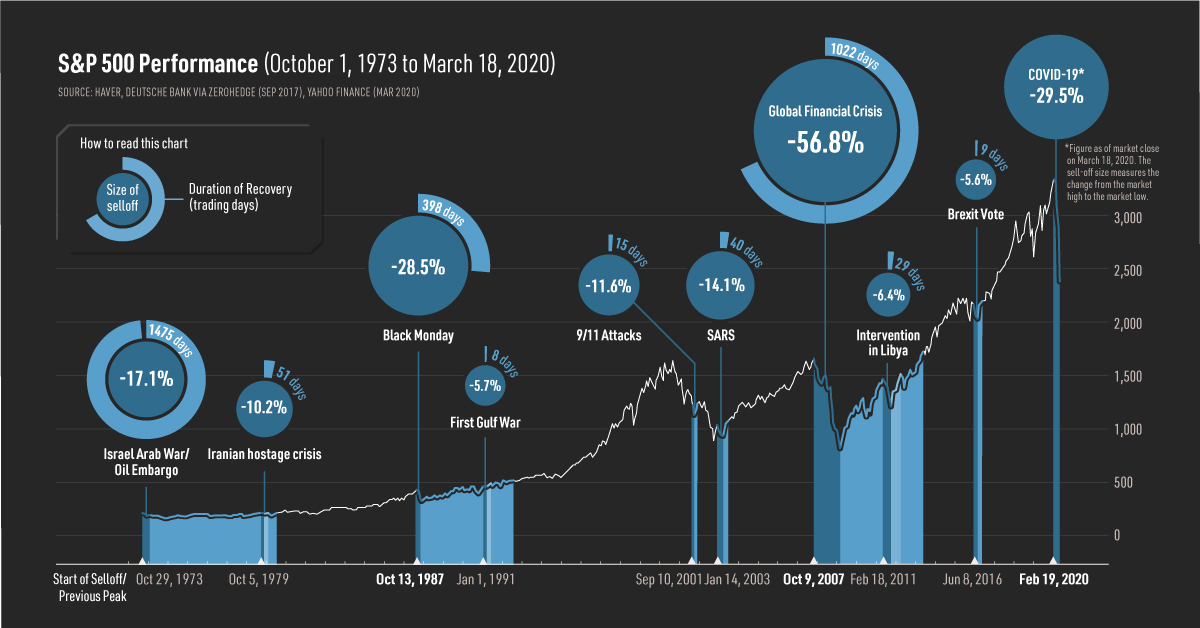
With sell-offs ranging from -5% to -50%, black swan events have all impacted the S&P 500 differently. Here’s a look at select events over the last half-century:
| Event | Start of Sell-off/Previous Peak | Size of Sell-off | Duration of Sell-off (Trading Days) | Duration of Recovery (Trading Days) |
|---|---|---|---|---|
| Israel Arab War/Oil Embargo | October 29, 1973 | -17.1% | 27 | 1475 |
| Iranian Hostage Crisis | October 5, 1979 | -10.2% | 24 | 51 |
| Black Monday | October 13, 1987 | -28.5% | 5 | 398 |
| First Gulf War | January 1, 1991 | -5.7% | 6 | 8 |
| 9/11 Attacks | September 10, 2001 | -11.6% | 6 | 15 |
| SARS | January 14, 2003 | -14.1% | 39 | 40 |
| Global Financial Crisis | October 9, 2007 | -56.8% | 356 | 1022 |
| Intervention in Libya | February 18, 2011 | -6.4% | 18 | 29 |
| Brexit Vote | June 8, 2016 | -5.6% | 14 | 9 |
| COVID-19* | February 19, 2020 | -29.5% | 19 | N/A (ongoing) |
* Figure as of market close on March 18, 2020. The sell-off measures from the market high to the market low.
While the declines can be severe, most have been short-lived. Markets typically returned to previous peak levels in no more than a couple of months. The Oil Embargo, Black Monday, and the Global Financial Crisis are notable outliers, with the recovery spanning a year or more.
After Black Monday, the Federal Reserve reaffirmed its readiness to provide liquidity, and the market recovered in about 400 trading days. Both the 1973 Oil Embargo and 2007 Global Financial Crisis led to U.S. recessions, lengthening the recovery over multiple years.
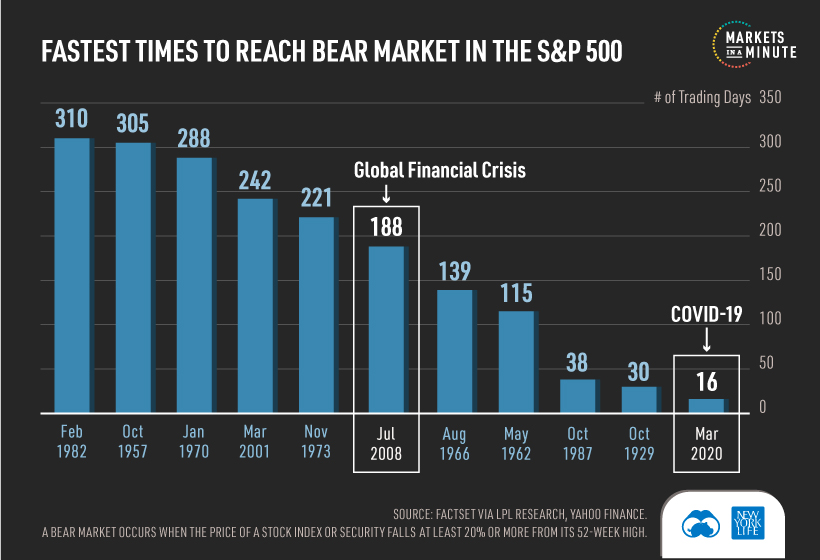
COVID-19: How Long Will it Last?
It’s difficult to predict how long COVID-19 will impact markets, as its societal and financial disruption is unprecedented. In fact, the S&P 500 reached a bear market in just 16 days, the fastest time period on record.
Some Wall Street strategists believe that the market will only begin to recover when COVID-19’s daily infection rate peaks. In the meantime, governments have begun announcing rate cuts and fiscal stimulus in order to help stabilize the economy.
Considering the high levels of uncertainty, what should investors do?
Buy on Fear, Sell on Greed?
Legendary investor Warren Buffet is a big proponent of this strategy. When others are greedy—typically when prices are boiling over—assets may be overpriced. On the flipside, there may be good buying opportunities when others are fearful.
Most importantly, investors need to remain disciplined with their investment process throughout the volatility. History has shown that markets will eventually recover, and may reward patient investors.
Note: This post originally came from our Advisor Channel, a partnership with New York Life Investments that aims to create a go-to resource for financial advisors and their clients to navigate market trends.


Markets
The European Stock Market: Attractive Valuations Offer Opportunities
On average, the European stock market has valuations that are nearly 50% lower than U.S. valuations. But how can you access the market?


European Stock Market: Attractive Valuations Offer Opportunities
Europe is known for some established brands, from L’Oréal to Louis Vuitton. However, the European stock market offers additional opportunities that may be lesser known.
The above infographic, sponsored by STOXX, outlines why investors may want to consider European stocks.
Attractive Valuations
Compared to most North American and Asian markets, European stocks offer lower or comparable valuations.
| Index | Price-to-Earnings Ratio | Price-to-Book Ratio |
|---|---|---|
| EURO STOXX 50 | 14.9 | 2.2 |
| STOXX Europe 600 | 14.4 | 2 |
| U.S. | 25.9 | 4.7 |
| Canada | 16.1 | 1.8 |
| Japan | 15.4 | 1.6 |
| Asia Pacific ex. China | 17.1 | 1.8 |
Data as of February 29, 2024. See graphic for full index names. Ratios based on trailing 12 month financials. The price to earnings ratio excludes companies with negative earnings.
On average, European valuations are nearly 50% lower than U.S. valuations, potentially offering an affordable entry point for investors.
Research also shows that lower price ratios have historically led to higher long-term returns.
Market Movements Not Closely Connected
Over the last decade, the European stock market had low-to-moderate correlation with North American and Asian equities.
The below chart shows correlations from February 2014 to February 2024. A value closer to zero indicates low correlation, while a value of one would indicate that two regions are moving in perfect unison.
| EURO STOXX 50 | STOXX EUROPE 600 | U.S. | Canada | Japan | Asia Pacific ex. China |
|
|---|---|---|---|---|---|---|
| EURO STOXX 50 | 1.00 | 0.97 | 0.55 | 0.67 | 0.24 | 0.43 |
| STOXX EUROPE 600 | 1.00 | 0.56 | 0.71 | 0.28 | 0.48 | |
| U.S. | 1.00 | 0.73 | 0.12 | 0.25 | ||
| Canada | 1.00 | 0.22 | 0.40 | |||
| Japan | 1.00 | 0.88 | ||||
| Asia Pacific ex. China | 1.00 |
Data is based on daily USD returns.
European equities had relatively independent market movements from North American and Asian markets. One contributing factor could be the differing sector weights in each market. For instance, technology makes up a quarter of the U.S. market, but health care and industrials dominate the broader European market.
Ultimately, European equities can enhance portfolio diversification and have the potential to mitigate risk for investors.
Tracking the Market
For investors interested in European equities, STOXX offers a variety of flagship indices:
| Index | Description | Market Cap |
|---|---|---|
| STOXX Europe 600 | Pan-regional, broad market | €10.5T |
| STOXX Developed Europe | Pan-regional, broad-market | €9.9T |
| STOXX Europe 600 ESG-X | Pan-regional, broad market, sustainability focus | €9.7T |
| STOXX Europe 50 | Pan-regional, blue-chip | €5.1T |
| EURO STOXX 50 | Eurozone, blue-chip | €3.5T |
Data is as of February 29, 2024. Market cap is free float, which represents the shares that are readily available for public trading on stock exchanges.
The EURO STOXX 50 tracks the Eurozone’s biggest and most traded companies. It also underlies one of the world’s largest ranges of ETFs and mutual funds. As of November 2023, there were €27.3 billion in ETFs and €23.5B in mutual fund assets under management tracking the index.
“For the past 25 years, the EURO STOXX 50 has served as an accurate, reliable and tradable representation of the Eurozone equity market.”
— Axel Lomholt, General Manager at STOXX
Partnering with STOXX to Track the European Stock Market
Are you interested in European equities? STOXX can be a valuable partner:
- Comprehensive, liquid and investable ecosystem
- European heritage, global reach
- Highly sophisticated customization capabilities
- Open architecture approach to using data
- Close partnerships with clients
- Part of ISS STOXX and Deutsche Börse Group
With a full suite of indices, STOXX can help you benchmark against the European stock market.
Learn how STOXX’s European indices offer liquid and effective market access.

-

 Economy2 days ago
Economic Growth Forecasts for G7 and BRICS Countries in 2024
The IMF has released its economic growth forecasts for 2024. How do the G7 and BRICS countries compare?
-

 Markets1 week ago
U.S. Debt Interest Payments Reach $1 Trillion
U.S. debt interest payments have surged past the $1 trillion dollar mark, amid high interest rates and an ever-expanding debt burden.
-

 United States2 weeks ago
Ranked: The Largest U.S. Corporations by Number of Employees
We visualized the top U.S. companies by employees, revealing the massive scale of retailers like Walmart, Target, and Home Depot.
-

 Markets2 weeks ago
The Top 10 States by Real GDP Growth in 2023
This graphic shows the states with the highest real GDP growth rate in 2023, largely propelled by the oil and gas boom.
-

 Markets2 weeks ago
Ranked: The World’s Top Flight Routes, by Revenue
In this graphic, we show the highest earning flight routes globally as air travel continued to rebound in 2023.
-

 Markets2 weeks ago
Ranked: The Most Valuable Housing Markets in America
The U.S. residential real estate market is worth a staggering $47.5 trillion. Here are the most valuable housing markets in the country.


-

 Energy1 week ago
The World’s Biggest Nuclear Energy Producers
-

 Money2 weeks ago
Which States Have the Highest Minimum Wage in America?
-

 Technology2 weeks ago
Ranked: Semiconductor Companies by Industry Revenue Share
-
Markets2 weeks ago
Ranked: The World’s Top Flight Routes, by Revenue
-

 Countries2 weeks ago
Population Projections: The World’s 6 Largest Countries in 2075
-
Markets2 weeks ago
The Top 10 States by Real GDP Growth in 2023
-

 Demographics2 weeks ago
The Smallest Gender Wage Gaps in OECD Countries
-

 United States2 weeks ago
Where U.S. Inflation Hit the Hardest in March 2024