Technology
Visualizing the Size of Amazon, the World’s Most Valuable Retailer
 Can I share this graphic?
 When do I need a license?
 Interested in this piece?
Visualizing the Size of the World’s Most Valuable Retailer
As brick-and-mortar chains teeter in the face of the pandemic, Amazon continues to gain ground.
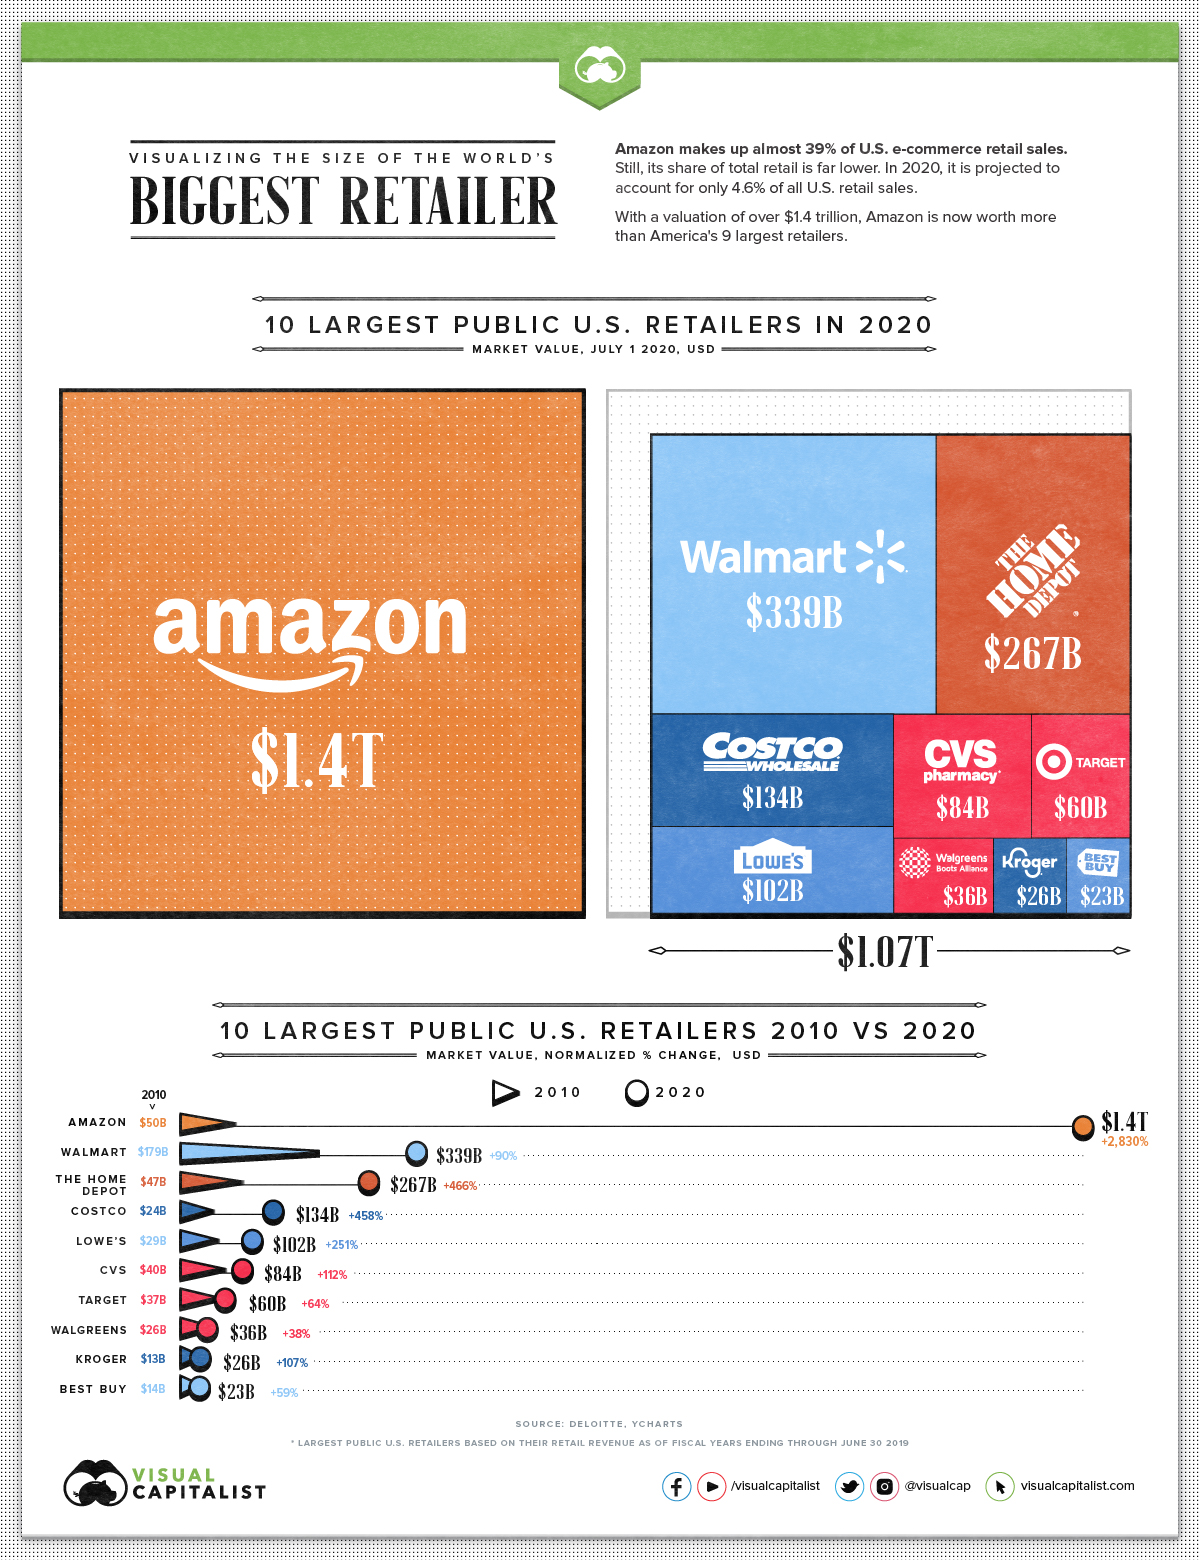
The retail juggernaut is valued at no less than $1.4 trillion—roughly four times what it was in late 2016 when its market cap hovered around $350 billion. Last year, the Jeff Bezos-led company shipped 2 billion packages around the world.
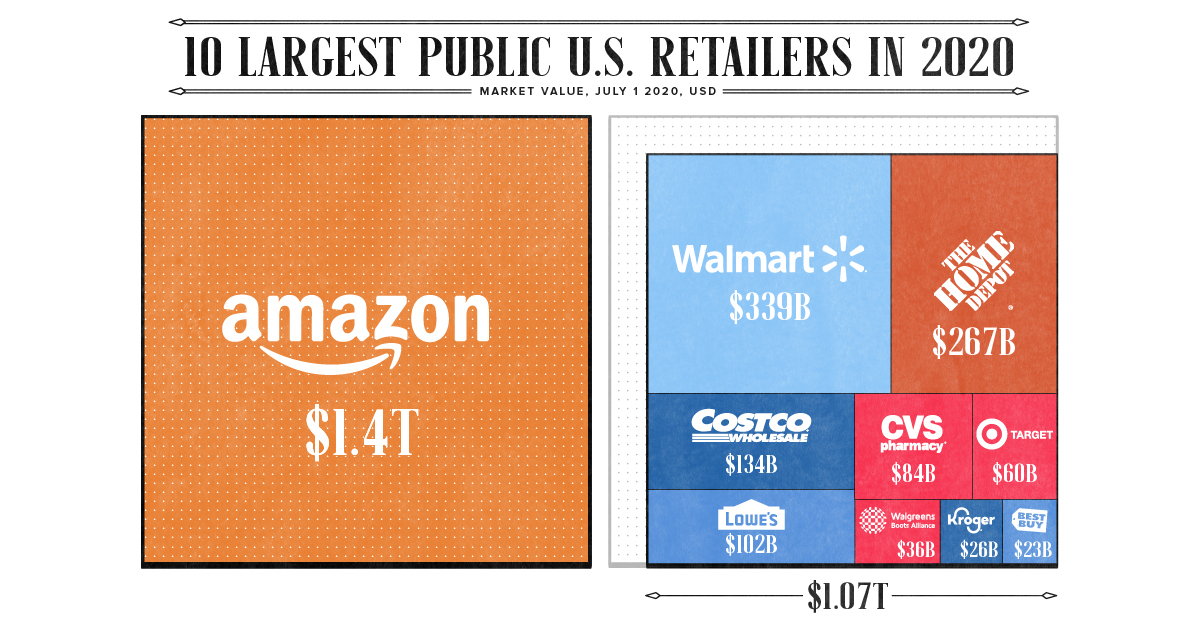
Today’s infographic shows how Amazon’s market cap alone is bigger than the nine biggest U.S. retailers put together, highlighting the palpable presence of the once modest online bookstore.
The New Normal
COVID-19’s sudden shift has rendered many retail outfits obsolete.
Neiman Marcus, JCPenney, and J.Crew have all filed for bankruptcy as consumer spending has migrated online. This, coupled with heavy debt loads across many retail chains, is only compounding the demise of brick-and-mortar. In fact, one estimate projects that at least 25,000 U.S. stores will fold over the next year.
Still, as safety and supply chain challenges mount—with COVID-19 related costs in the billions—Amazon remains at the top. It surpasses its next closest competitor, Walmart, by $1 trillion in market valuation.
How does Amazon compare to the largest retailers in the U.S.?
| 10 Largest Public US Retailers* | Market Value July 1, 2020 | Market Value July 1, 2010 | Normalized % Change 2010-2020 | Retail Revenue |
|---|---|---|---|---|
| Walmart | $339B | $179B | 90% | $514B |
| Costco | $134B | $24B | 458% | $142B |
| Amazon | $1,400B | $50B | 2,830% | $140B |
| The Kroger Co. | $26B | $13B | 107% | $118Be |
| Walgreens Boots Alliance | $36B | $26B | 38% | $111B |
| The Home Depot | $267B | $47B | 466% | $108B |
| CVS | $84B | $40B | 112% | $84B |
| Target | $60B | $37B | 64% | $74B |
| Lowe's | $102B | $29B | 251% | $71B |
| Best Buy | $23B | $14B | 59% | $43B |
| Combined value of retailers (without Amazon) | $1,071B |
Source: Deloitte, YCharts
*Largest public US retailers based on their retail revenue as of fiscal years ending through June 30, 2019, e=estimated
With nearly a 39% share of U.S. e-commerce retail sales, Amazon’s market cap has grown 2,830% over the last decade. Its business model, which aggressively pursues market dominance instead of focusing on short-term profits, is one factor behinds the rise.
By the same token, one recent estimate by The Economist pegged Amazon’s retail operating margins at -1% last year. Another analyst has suggested that the company purposefully sells retail goods at a loss.
How Amazon makes up for this operating shortfall is through its cash-generating cloud service, Amazon Web Services (AWS), and through a collection of diversified enterprise-focused services. AWS, with estimated operating margins of 26%, brought in $9.2 billion in profits in 2019—more than half of Amazon’s total.
Amazon’s Basket of Eggs
Unlike many of its retail competitors, Amazon has rapidly diversified its acquisitions since it originated in 1994.
Take the $1.2 billion acquisition of Zoox. Amazon plans to operate self-driving taxi fleets, all of which are designed without steering wheels. It is the company’s third largest since the $13.7 billion acquisition of organic grocer Whole Foods, followed by Zappos.
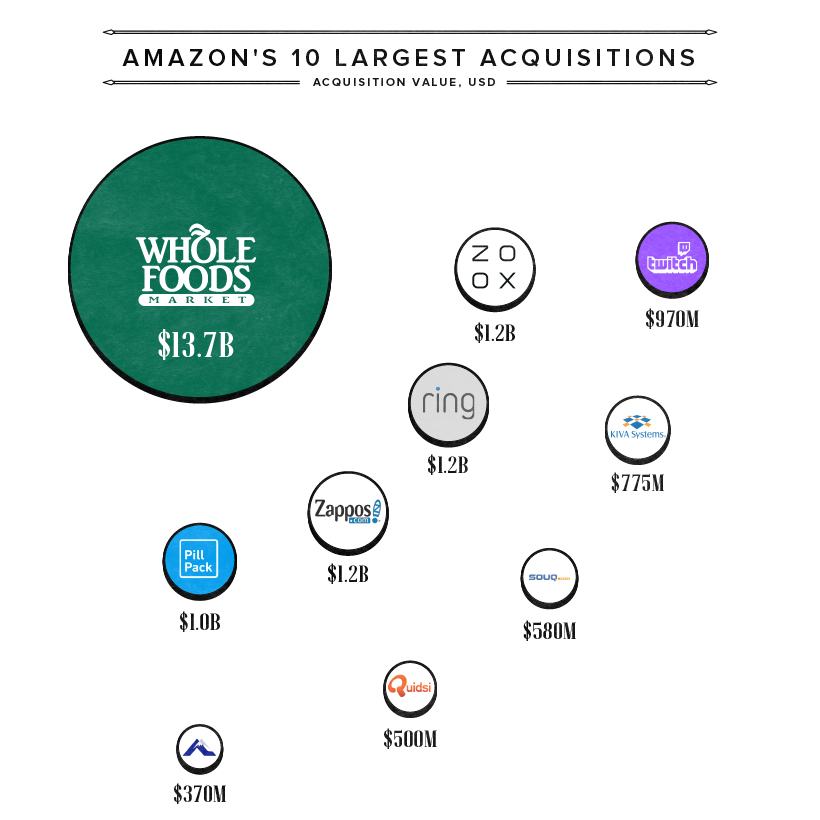
Accounting for the lion’s share of Amazon-owned physical stores, Whole Foods has 508 stores across the U.S., UK, and Canada. While Amazon doesn’t outline revenues across its physical retail segments—which include Amazon Books stores, Amazon Go stores, and others—physical store sales tipped over $17 billion in 2019.
Meanwhile, Amazon also owns gaming streaming platform Twitch, which it acquired for $970 million in 2017. Currently, Twitch makes up 73% of the streaming market and brought in an estimated $300 million in ad revenues in 2019.
Carrying On
Despite the flood of online orders due to quarantines and social distancing requirements, Amazon’s bottom line has suffered. In the second quarter of 2020 alone, it is expected to rack up $4 billion in pandemic-related costs.
Yet, at the same time, its customer-obsessed business model appears to thrive under current market conditions. As of July 1, its stock price has spiked over 51% year-to-date. On an annualized basis, that’s roughly 100% in returns.
As margins get squeezed and expenses grow, is Amazon’s growth sustainable in the long-term? Or, are the company’s strategic acquisitions and revenue streams providing the catalysts (and cash) for only more short-term success?


Technology
All of the Grants Given by the U.S. CHIPS Act
Intel, TSMC, and more have received billions in subsidies from the U.S. CHIPS Act in 2024.


All of the Grants Given by the U.S. CHIPS Act
This was originally posted on our Voronoi app. Download the app for free on iOS or Android and discover incredible data-driven charts from a variety of trusted sources.
This visualization shows which companies are receiving grants from the U.S. CHIPS Act, as of April 25, 2024. The CHIPS Act is a federal statute signed into law by President Joe Biden that authorizes $280 billion in new funding to boost domestic research and manufacturing of semiconductors.
The grant amounts visualized in this graphic are intended to accelerate the production of semiconductor fabrication plants (fabs) across the United States.
Data and Company Highlights
The figures we used to create this graphic were collected from a variety of public news sources. The Semiconductor Industry Association (SIA) also maintains a tracker for CHIPS Act recipients, though at the time of writing it does not have the latest details for Micron.
| Company | Federal Grant Amount | Anticipated Investment From Company |
|---|---|---|
| 🇺🇸 Intel | $8,500,000,000 | $100,000,000,000 |
| 🇹🇼 TSMC | $6,600,000,000 | $65,000,000,000 |
| 🇰🇷 Samsung | $6,400,000,000 | $45,000,000,000 |
| 🇺🇸 Micron | $6,100,000,000 | $50,000,000,000 |
| 🇺🇸 GlobalFoundries | $1,500,000,000 | $12,000,000,000 |
| 🇺🇸 Microchip | $162,000,000 | N/A |
| 🇬🇧 BAE Systems | $35,000,000 | N/A |
BAE Systems was not included in the graphic due to size limitations
Intel’s Massive Plans
Intel is receiving the largest share of the pie, with $8.5 billion in grants (plus an additional $11 billion in government loans). This grant accounts for 22% of the CHIPS Act’s total subsidies for chip production.
From Intel’s side, the company is expected to invest $100 billion to construct new fabs in Arizona and Ohio, while modernizing and/or expanding existing fabs in Oregon and New Mexico. Intel could also claim another $25 billion in credits through the U.S. Treasury Department’s Investment Tax Credit.
TSMC Expands its U.S. Presence
TSMC, the world’s largest semiconductor foundry company, is receiving a hefty $6.6 billion to construct a new chip plant with three fabs in Arizona. The Taiwanese chipmaker is expected to invest $65 billion into the project.
The plant’s first fab will be up and running in the first half of 2025, leveraging 4 nm (nanometer) technology. According to TrendForce, the other fabs will produce chips on more advanced 3 nm and 2 nm processes.
The Latest Grant Goes to Micron
Micron, the only U.S.-based manufacturer of memory chips, is set to receive $6.1 billion in grants to support its plans of investing $50 billion through 2030. This investment will be used to construct new fabs in Idaho and New York.

-

 Energy1 week ago
The World’s Biggest Nuclear Energy Producers
-

 Money2 weeks ago
Which States Have the Highest Minimum Wage in America?
-

 Technology2 weeks ago
Ranked: Semiconductor Companies by Industry Revenue Share
-

 Markets2 weeks ago
Ranked: The World’s Top Flight Routes, by Revenue
-

 Countries2 weeks ago
Population Projections: The World’s 6 Largest Countries in 2075
-

 Markets2 weeks ago
The Top 10 States by Real GDP Growth in 2023
-

 Demographics2 weeks ago
The Smallest Gender Wage Gaps in OECD Countries
-

 United States2 weeks ago
Where U.S. Inflation Hit the Hardest in March 2024