Markets
Visualizing $97 Trillion of Global Debt in 2023
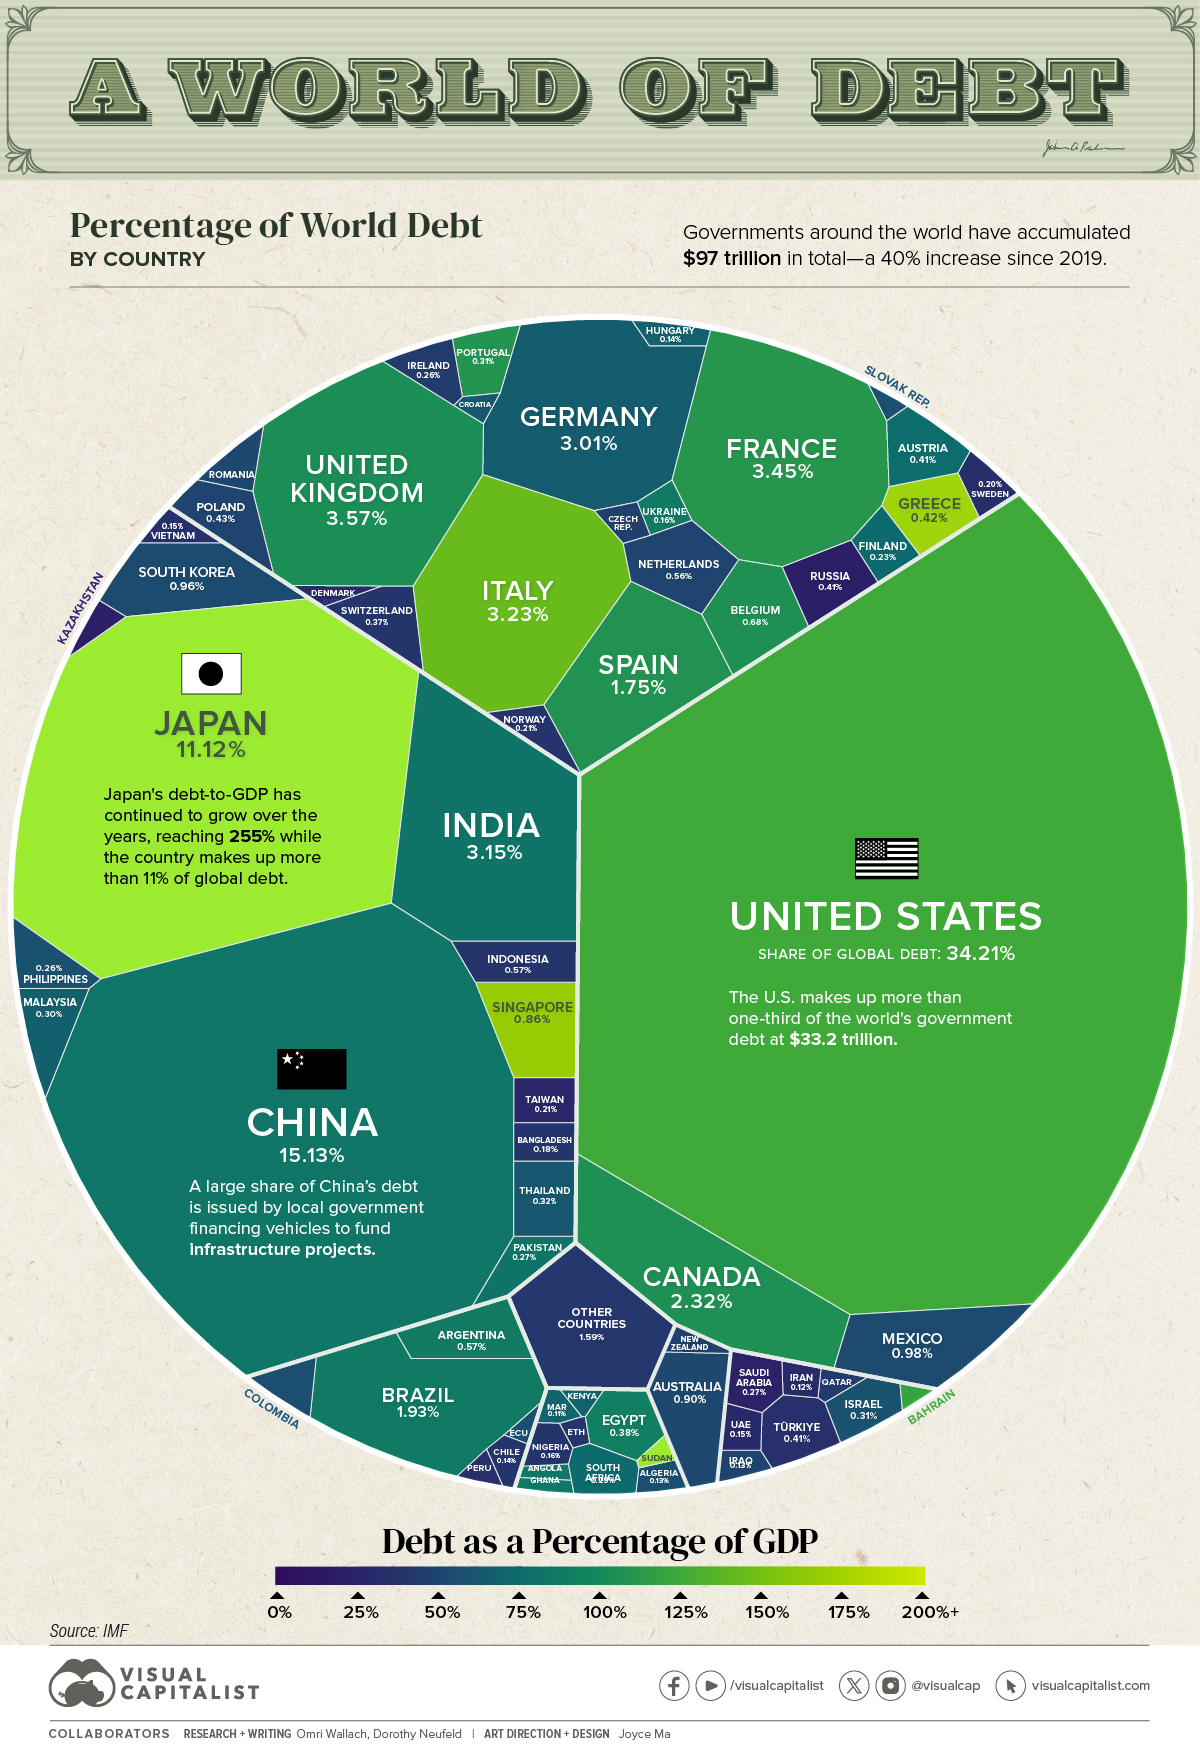


Visualizing $97 Trillion of Government Debt in 2023
Global government debt is projected to hit $97.1 trillion this year, a 40% increase since 2019.
During the COVID-19 pandemic, governments introduced sweeping financial measures to support the job market and prevent a wave of bankruptcies. However, this has exposed vulnerabilities as higher interest rates are amplifying borrowing costs.
This graphic shows global debt by country in 2023, based on projections from the International Monetary Fund (IMF).
Debt by Country in 2023
Below, we rank countries by their general government gross debt, or the financial liabilities owed by each country:
| Country | Gross Debt (B) | % of World Total | Debt to GDP |
|---|---|---|---|
| 🇺🇸 U.S. | $33,228.9 | 34.2% | 123.3% |
| 🇨🇳 China | $14,691.7 | 15.1% | 83.0% |
| 🇯🇵 Japan | $10,797.2 | 11.1% | 255.2% |
| 🇬🇧 UK | $3,468.7 | 3.6% | 104.1% |
| 🇫🇷 France | $3,353.9 | 3.5% | 110.0% |
| 🇮🇹 Italy | $3,141.4 | 3.2% | 143.7% |
| 🇮🇳 India | $3,056.7 | 3.1% | 81.9% |
| 🇩🇪 Germany | $2,919.3 | 3.0% | 65.9% |
| 🇨🇦 Canada | $2,253.3 | 2.3% | 106.4% |
| 🇧🇷 Brazil | $1,873.7 | 1.9% | 88.1% |
| 🇪🇸 Spain | $1,697.5 | 1.7% | 107.3% |
| 🇲🇽 Mexico | $954.6 | 1.0% | 52.7% |
| 🇰🇷 South Korea | $928.1 | 1.0% | 54.3% |
| 🇦🇺 Australia | $875.9 | 0.9% | 51.9% |
| 🇸🇬 Singapore | $835.0 | 0.9% | 167.9% |
| 🇧🇪 Belgium | $665.2 | 0.7% | 106.0% |
| 🇦🇷 Argentina | $556.5 | 0.6% | 89.5% |
| 🇮🇩 Indonesia | $552.8 | 0.6% | 39.0% |
| 🇳🇱 Netherlands | $540.9 | 0.6% | 49.5% |
| 🇵🇱 Poland | $419.4 | 0.4% | 49.8% |
| 🇬🇷 Greece | $407.2 | 0.4% | 168.0% |
| 🇹🇷 Türkiye | $397.2 | 0.4% | 34.4% |
| 🇷🇺 Russia | $394.8 | 0.4% | 21.2% |
| 🇦🇹 Austria | $393.6 | 0.4% | 74.8% |
| 🇪🇬 Egypt | $369.3 | 0.4% | 92.7% |
| 🇨🇭 Switzerland | $357.7 | 0.4% | 39.5% |
| 🇹🇭 Thailand | $314.5 | 0.3% | 61.4% |
| 🇮🇱 Israel | $303.6 | 0.3% | 58.2% |
| 🇵🇹 Portugal | $299.4 | 0.3% | 108.3% |
| 🇲🇾 Malaysia | $288.3 | 0.3% | 66.9% |
| 🇿🇦 South Africa | $280.7 | 0.3% | 73.7% |
| 🇵🇰 Pakistan | $260.9 | 0.3% | 76.6% |
| 🇸🇦 Saudi Arabia | $257.7 | 0.3% | 24.1% |
| 🇮🇪 Ireland | $251.7 | 0.3% | 42.7% |
| 🇵🇭 Philippines | $250.9 | 0.3% | 57.6% |
| 🇫🇮 Finland | $225.0 | 0.2% | 73.6% |
| 🇳🇴 Norway | $204.5 | 0.2% | 37.4% |
| 🇨🇴 Colombia | $200.1 | 0.2% | 55.0% |
| 🇹🇼 Taiwan | $200.0 | 0.2% | 26.6% |
| 🇸🇪 Sweden | $192.9 | 0.2% | 32.3% |
| 🇷🇴 Romania | $178.7 | 0.2% | 51.0% |
| 🇧🇩 Bangladesh | $175.9 | 0.2% | 39.4% |
| 🇺🇦 Ukraine | $152.8 | 0.2% | 88.1% |
| 🇨🇿 Czech Republic | $152.2 | 0.2% | 45.4% |
| 🇳🇬 Nigeria | $151.3 | 0.2% | 38.8% |
| 🇦🇪 UAE | $149.7 | 0.2% | 29.4% |
| 🇻🇳 Vietnam | $147.3 | 0.2% | 34.0% |
| 🇭🇺 Hungary | $140.0 | 0.1% | 68.7% |
| 🇨🇱 Chile | $132.2 | 0.1% | 38.4% |
| 🇩🇰 Denmark | $126.7 | 0.1% | 30.1% |
| 🇮🇶 Iraq | $125.5 | 0.1% | 49.2% |
| 🇩🇿 Algeria | $123.5 | 0.1% | 55.1% |
| 🇳🇿 New Zealand | $115.0 | 0.1% | 46.1% |
| 🇮🇷 Iran | $112.1 | 0.1% | 30.6% |
| 🇲🇦 Morocco | $102.7 | 0.1% | 69.7% |
| 🇶🇦 Qatar | $97.5 | 0.1% | 41.4% |
| 🇵🇪 Peru | $89.7 | 0.1% | 33.9% |
| 🇦🇴 Angola | $79.6 | 0.1% | 84.9% |
| 🇰🇪 Kenya | $79.1 | 0.1% | 70.2% |
| 🇸🇰 Slovakia | $75.4 | 0.1% | 56.7% |
| 🇩🇴 Dominican Republic | $72.1 | 0.1% | 59.8% |
| 🇪🇨 Ecuador | $65.9 | 0.1% | 55.5% |
| 🇸🇩 Sudan | $65.5 | 0.1% | 256.0% |
| 🇬🇭 Ghana | $65.1 | 0.1% | 84.9% |
| 🇰🇿 Kazakhstan | $60.7 | 0.1% | 23.4% |
| 🇪🇹 Ethiopia | $59.0 | 0.1% | 37.9% |
| 🇧🇭 Bahrain | $54.5 | 0.1% | 121.2% |
| 🇨🇷 Costa Rica | $53.9 | 0.1% | 63.0% |
| 🇭🇷 Croatia | $51.2 | 0.1% | 63.8% |
| 🇺🇾 Uruguay | $47.0 | 0.0% | 61.6% |
| 🇯🇴 Jordan | $46.9 | 0.0% | 93.8% |
| 🇸🇮 Slovenia | $46.8 | 0.0% | 68.5% |
| 🇨🇮 Côte d'Ivoire | $45.1 | 0.0% | 56.8% |
| 🇵🇦 Panama | $43.5 | 0.0% | 52.8% |
| 🇲🇲 Myanmar | $43.0 | 0.0% | 57.5% |
| 🇴🇲 Oman | $41.4 | 0.0% | 38.2% |
| 🇹🇳 Tunisia | $39.9 | 0.0% | 77.8% |
| 🇷🇸 Serbia | $38.5 | 0.0% | 51.3% |
| 🇧🇴 Bolivia | $37.8 | 0.0% | 80.8% |
| 🇹🇿 Tanzania | $35.8 | 0.0% | 42.6% |
| 🇺🇿 Uzbekistan | $31.7 | 0.0% | 35.1% |
| 🇿🇼 Zimbabwe | $30.9 | 0.0% | 95.4% |
| 🇧🇾 Belarus | $30.4 | 0.0% | 44.1% |
| 🇬🇹 Guatemala | $29.1 | 0.0% | 28.3% |
| 🇱🇹 Lithuania | $28.7 | 0.0% | 36.1% |
| 🇸🇻 El Salvador | $25.8 | 0.0% | 73.0% |
| 🇺🇬 Uganda | $25.3 | 0.0% | 48.3% |
| 🇸🇳 Senegal | $25.2 | 0.0% | 81.0% |
| 🇨🇾 Cyprus | $25.2 | 0.0% | 78.6% |
| 🇱🇺 Luxembourg | $24.6 | 0.0% | 27.6% |
| 🇭🇰 Hong Kong SAR | $23.5 | 0.0% | 6.1% |
| 🇧🇬 Bulgaria | $21.7 | 0.0% | 21.0% |
| 🇨🇲 Cameroon | $20.6 | 0.0% | 41.9% |
| 🇲🇿 Mozambique | $19.7 | 0.0% | 89.7% |
| 🇵🇷 Puerto Rico | $19.6 | 0.0% | 16.7% |
| 🇳🇵 Nepal | $19.3 | 0.0% | 46.7% |
| 🇱🇻 Latvia | $18.9 | 0.0% | 40.6% |
| 🇮🇸 Iceland | $18.7 | 0.0% | 61.2% |
| 🇵🇾 Paraguay | $18.1 | 0.0% | 40.9% |
| 🇱🇦 Lao P.D.R. | $17.3 | 0.0% | 121.7% |
| 🇭🇳 Honduras | $15.7 | 0.0% | 46.3% |
| 🇵🇬 Papua New Guinea | $15.7 | 0.0% | 49.5% |
| 🇹🇹 Trinidad and Tobago | $14.6 | 0.0% | 52.5% |
| 🇦🇱 Albania | $14.5 | 0.0% | 62.9% |
| 🇨🇬 Republic of Congo | $14.1 | 0.0% | 97.8% |
| 🇦🇿 Azerbaijan | $14.1 | 0.0% | 18.2% |
| 🇾🇪 Yemen | $14.0 | 0.0% | 66.4% |
| 🇯🇲 Jamaica | $13.6 | 0.0% | 72.3% |
| 🇲🇳 Mongolia | $13.1 | 0.0% | 69.9% |
| 🇧🇫 Burkina Faso | $12.7 | 0.0% | 61.2% |
| 🇬🇦 Gabon | $12.5 | 0.0% | 64.9% |
| 🇬🇪 Georgia | $11.9 | 0.0% | 39.6% |
| 🇲🇺 Mauritius | $11.8 | 0.0% | 79.7% |
| 🇦🇲 Armenia | $11.8 | 0.0% | 47.9% |
| 🇧🇸 Bahamas | $11.7 | 0.0% | 84.2% |
| 🇲🇱 Mali | $11.0 | 0.0% | 51.8% |
| 🇲🇹 Malta | $11.0 | 0.0% | 54.1% |
| 🇰🇭 Cambodia | $10.9 | 0.0% | 35.3% |
| 🇧🇯 Benin | $10.6 | 0.0% | 53.0% |
| 🇲🇼 Malawi | $10.4 | 0.0% | 78.6% |
| 🇪🇪 Estonia | $9.0 | 0.0% | 21.6% |
| 🇨🇩 Democratic Republic of Congo | $9.0 | 0.0% | 13.3% |
| 🇷🇼 Rwanda | $8.8 | 0.0% | 63.3% |
| 🇳🇦 Namibia | $8.5 | 0.0% | 67.6% |
| 🇲🇬 Madagascar | $8.5 | 0.0% | 54.0% |
| 🇳🇪 Niger | $8.3 | 0.0% | 48.7% |
| 🇲🇰 North Macedonia | $8.2 | 0.0% | 51.6% |
| 🇧🇦 Bosnia and Herzegovina | $7.7 | 0.0% | 28.6% |
| 🇲🇻 Maldives | $7.7 | 0.0% | 110.3% |
| 🇬🇳 Guinea | $7.3 | 0.0% | 31.6% |
| 🇳🇮 Nicaragua | $7.2 | 0.0% | 41.5% |
| 🇧🇧 Barbados | $7.2 | 0.0% | 115.0% |
| 🇹🇬 Togo | $6.1 | 0.0% | 67.2% |
| 🇰🇬 Kyrgyz Republic | $6.0 | 0.0% | 47.0% |
| 🇲🇩 Moldova | $5.6 | 0.0% | 35.1% |
| 🇹🇩 Chad | $5.4 | 0.0% | 43.2% |
| 🇰🇼 Kuwait | $5.4 | 0.0% | 3.4% |
| 🇲🇷 Mauritania | $5.1 | 0.0% | 49.5% |
| 🇭🇹 Haiti | $5.1 | 0.0% | 19.6% |
| 🇬🇾 Guyana | $4.9 | 0.0% | 29.9% |
| 🇲🇪 Montenegro | $4.6 | 0.0% | 65.8% |
| 🇫🇯 Fiji | $4.6 | 0.0% | 83.6% |
| 🇹🇲 Turkmenistan | $4.2 | 0.0% | 5.1% |
| 🇹🇯 Tajikistan | $4.0 | 0.0% | 33.5% |
| 🇧🇼 Botswana | $3.9 | 0.0% | 18.7% |
| 🇬🇶 Equatorial Guinea | $3.8 | 0.0% | 38.3% |
| 🇸🇷 Suriname | $3.8 | 0.0% | 107.0% |
| 🇸🇸 South Sudan | $3.8 | 0.0% | 60.4% |
| 🇧🇹 Bhutan | $3.3 | 0.0% | 123.4% |
| 🇦🇼 Aruba | $3.2 | 0.0% | 82.9% |
| 🇸🇱 Sierra Leone | $3.1 | 0.0% | 88.9% |
| 🇨🇻 Cabo Verde | $2.9 | 0.0% | 113.1% |
| 🇧🇮 Burundi | $2.3 | 0.0% | 72.7% |
| 🇱🇷 Liberia | $2.3 | 0.0% | 52.3% |
| 🇽🇰 Kosovo | $2.2 | 0.0% | 21.3% |
| 🇸🇿 Eswatini | $2.0 | 0.0% | 42.4% |
| 🇧🇿 Belize | $1.9 | 0.0% | 59.3% |
| 🇱🇨 Saint Lucia | $1.8 | 0.0% | 74.2% |
| 🇬🇲 Gambia | $1.7 | 0.0% | 72.3% |
| 🇩🇯 Djibouti | $1.6 | 0.0% | 41.8% |
| 🇦🇬 Antigua and Barbuda | $1.6 | 0.0% | 80.5% |
| 🇸🇲 San Marino | $1.5 | 0.0% | 74.0% |
| 🇬🇼 Guinea-Bissau | $1.5 | 0.0% | 73.9% |
| 🇱🇸 Lesotho | $1.5 | 0.0% | 61.3% |
| 🇦🇩 Andorra | $1.4 | 0.0% | 37.7% |
| 🇨🇫 Central African Republic | $1.4 | 0.0% | 50.1% |
| 🇸🇨 Seychelles | $1.3 | 0.0% | 60.8% |
| 🇻🇨 Saint Vincent and the Grenadines | $0.9 | 0.0% | 86.2% |
| 🇬🇩 Grenada | $0.8 | 0.0% | 60.2% |
| 🇩🇲 Dominica | $0.7 | 0.0% | 93.9% |
| 🇰🇳 Saint Kitts and Nevis | $0.6 | 0.0% | 53.2% |
| 🇻🇺 Vanuatu | $0.5 | 0.0% | 46.8% |
| 🇰🇲 Comoros | $0.5 | 0.0% | 33.3% |
| 🇸🇹 São Tomé and Príncipe | $0.4 | 0.0% | 58.5% |
| 🇸🇧 Solomon Islands | $0.4 | 0.0% | 22.2% |
| 🇧🇳 Brunei Darussalam | $0.3 | 0.0% | 2.3% |
| 🇼🇸 Samoa | $0.3 | 0.0% | 36.2% |
| 🇹🇱 Timor-Leste | $0.3 | 0.0% | 16.4% |
| 🇵🇼 Palau | $0.2 | 0.0% | 85.4% |
| 🇹🇴 Tonga | $0.2 | 0.0% | 41.1% |
| 🇫🇲 Micronesia | $0.1 | 0.0% | 12.5% |
| 🇲🇭 Marshall Islands | $0.1 | 0.0% | 18.1% |
| 🇳🇷 Nauru | <$0.1 | 0.0% | 29.1% |
| 🇰🇮 Kiribati | <$0.1 | 0.0% | 13.1% |
| 🇹🇻 Tuvalu | <$0.1 | 0.0% | 8.0% |
| 🇲🇴 Macao SAR | <$0.1 | 0.0% | 0.0% |
| 🌐 World | $97,129.8 | 100% | 93.0% |
With $33.2 trillion in government debt, the U.S. makes up over a third of the world total.
Given the increasing debt load, the cost of servicing this debt now accounts for 20% of government spending. It is projected to reach $1 trillion by 2028, surpassing the total spent on defense.
The world’s third-biggest economy, Japan, has one of the highest debt to GDP ratios, at 255%. Over the last two decades, its national debt has far exceeded 100% of its GDP, driven by an aging population and social security expenses.
In 2023, Egypt faces steep borrowing costs, with 40% of revenues going towards debt repayments. It has the highest debt on the continent.
Like Egypt, several emerging economies are facing strain. Lebanon has been in default since 2020, and Ghana defaulted on the majority of its external debt—debt owed to foreign lenders—in 2022 amid a deepening economic crisis.
Global Debt: A Regional Perspective
How does debt compare on a regional level in 2023?
| Region | Gross Debt (B) | % of World Total | Debt to GDP |
|---|---|---|---|
| North America | $36,451.8 | 37.5% | 117.6% |
| Asia and Pacific | $34,257.4 | 35.3% | 92.5% |
| Europe | $20,123.4 | 20.7% | 79.1% |
| South America | $3,164.9 | 3.3% | 77.2% |
| Africa | $1,863.6 | 1.9% | 65.2% |
| Other/Rest of World | $1,269.1 | 1.3% | 31.4% |
We can see that North America has both the highest debt and debt to GDP compared to other regions. Just as U.S. debt has ballooned, so has Canada’s—ranking as the 10th-highest globally in government debt outstanding.
Across Asia and the Pacific, debt levels hover close to North America.
At 3.3% of the global total, South America has $3.2 trillion in debt. As inflation has trended downwards, a handful of governments have already begun cutting interest rates. Overall, public debt levels are projected to stay elevated across the region.
Debt levels have also risen rapidly in Africa, with an average 40% of public debt held in foreign currencies—leaving it exposed to exchange rate fluctuations. Another challenge is that interest rates are also higher across the region compared to advanced economies, increasing debt-servicing costs.
By 2028, the IMF projects that global public debt will exceed 100% of GDP, hitting levels only seen during the pandemic.


Markets
Mapped: Europe’s GDP Per Capita, by Country
Which European economies are richest on a GDP per capita basis? This map shows the results for 44 countries across the continent.


Mapped: Europe’s GDP Per Capita, by Country (2024)
This was originally posted on our Voronoi app. Download the app for free on iOS or Android and discover incredible data-driven charts from a variety of trusted sources.
Europe is home to some of the largest and most sophisticated economies in the world. But how do countries in the region compare with each other on a per capita productivity basis?
In this map, we show Europe’s GDP per capita levels across 44 nations in current U.S. dollars. Data for this visualization and article is sourced from the International Monetary Fund (IMF) via their DataMapper tool, updated April 2024.
Europe’s Richest and Poorest Nations, By GDP Per Capita
Luxembourg, Ireland, and Switzerland, lead the list of Europe’s richest nations by GDP per capita, all above $100,000.
| Rank | Country | GDP Per Capita (2024) |
|---|---|---|
| 1 | 🇱🇺 Luxembourg | $131,380 |
| 2 | 🇮🇪 Ireland | $106,060 |
| 3 | 🇨🇭 Switzerland | $105,670 |
| 4 | 🇳🇴 Norway | $94,660 |
| 5 | 🇮🇸 Iceland | $84,590 |
| 6 | 🇩🇰 Denmark | $68,900 |
| 7 | 🇳🇱 Netherlands | $63,750 |
| 8 | 🇸🇲 San Marino | $59,410 |
| 9 | 🇦🇹 Austria | $59,230 |
| 10 | 🇸🇪 Sweden | $58,530 |
| 11 | 🇧🇪 Belgium | $55,540 |
| 12 | 🇫🇮 Finland | $55,130 |
| 13 | 🇩🇪 Germany | $54,290 |
| 14 | 🇬🇧 UK | $51,070 |
| 15 | 🇫🇷 France | $47,360 |
| 16 | 🇦🇩 Andorra | $44,900 |
| 17 | 🇲🇹 Malta | $41,740 |
| 18 | 🇮🇹 Italy | $39,580 |
| 19 | 🇨🇾 Cyprus | $37,150 |
| 20 | 🇪🇸 Spain | $34,050 |
| 21 | 🇸🇮 Slovenia | $34,030 |
| 22 | 🇪🇪 Estonia | $31,850 |
| 23 | 🇨🇿 Czech Republic | $29,800 |
| 24 | 🇵🇹 Portugal | $28,970 |
| 25 | 🇱🇹 Lithuania | $28,410 |
| 26 | 🇸🇰 Slovakia | $25,930 |
| 27 | 🇱🇻 Latvia | $24,190 |
| 28 | 🇬🇷 Greece | $23,970 |
| 29 | 🇭🇺 Hungary | $23,320 |
| 30 | 🇵🇱 Poland | $23,010 |
| 31 | 🇭🇷 Croatia | $22,970 |
| 32 | 🇷🇴 Romania | $19,530 |
| 33 | 🇧🇬 Bulgaria | $16,940 |
| 34 | 🇷🇺 Russia | $14,390 |
| 35 | 🇹🇷 Türkiye | $12,760 |
| 36 | 🇲🇪 Montenegro | $12,650 |
| 37 | 🇷🇸 Serbia | $12,380 |
| 38 | 🇦🇱 Albania | $8,920 |
| 39 | 🇧🇦 Bosnia & Herzegovina | $8,420 |
| 40 | 🇲🇰 North Macedonia | $7,690 |
| 41 | 🇧🇾 Belarus | $7,560 |
| 42 | 🇲🇩 Moldova | $7,490 |
| 43 | 🇽🇰 Kosovo | $6,390 |
| 44 | 🇺🇦 Ukraine | $5,660 |
| N/A | 🇪🇺 EU Average | $44,200 |
Note: Figures are rounded.
Three Nordic countries (Norway, Iceland, Denmark) also place highly, between $70,000-90,000. Other Nordic peers, Sweden and Finland rank just outside the top 10, between $55,000-60,000.
Meanwhile, Europe’s biggest economies in absolute terms, Germany, UK, and France, rank closer to the middle of the top 20, with GDP per capitas around $50,000.
Finally, at the end of the scale, Eastern Europe as a whole tends to have much lower per capita GDPs. In that group, Ukraine ranks last, at $5,660.
A Closer Look at Ukraine
For a broader comparison, Ukraine’s per capita GDP is similar to Iran ($5,310), El Salvador ($5,540), and Guatemala ($5,680).
According to experts, Ukraine’s economy has historically underperformed to expectations. After the fall of the Berlin Wall, the economy contracted for five straight years. Its transition to a Western, liberalized economic structure was overshadowed by widespread corruption, a limited taxpool, and few revenue sources.
Politically, its transformation from authoritarian regime to civil democracy has proved difficult, especially when it comes to institution building.
Finally, after the 2022 invasion of the country, Ukraine’s GDP contracted by 30% in a single year—the largest loss since independence. Large scale emigration—to the tune of six million refugees—is also playing a role.
Despite these challenges, the country’s economic growth has somewhat stabilized while fighting continues.

-

 Markets5 days ago
Visualizing Global Inflation Forecasts (2024-2026)
-

 Green2 weeks ago
The Carbon Footprint of Major Travel Methods
-

 United States2 weeks ago
Visualizing the Most Common Pets in the U.S.
-

 Culture2 weeks ago
The World’s Top Media Franchises by All-Time Revenue
-

 voronoi1 week ago
Best Visualizations of April on the Voronoi App
-

 Wealth1 week ago
Charted: Which Country Has the Most Billionaires in 2024?
-

 Business1 week ago
The Top Private Equity Firms by Country
-

 Markets1 week ago
The Best U.S. Companies to Work for According to LinkedIn