Mining
200 Years of Global Gold Production, by Country
![]() Subscribe to the Elements free mailing list for more like this
Subscribe to the Elements free mailing list for more like this
Click on the image to view the high-resolution version.
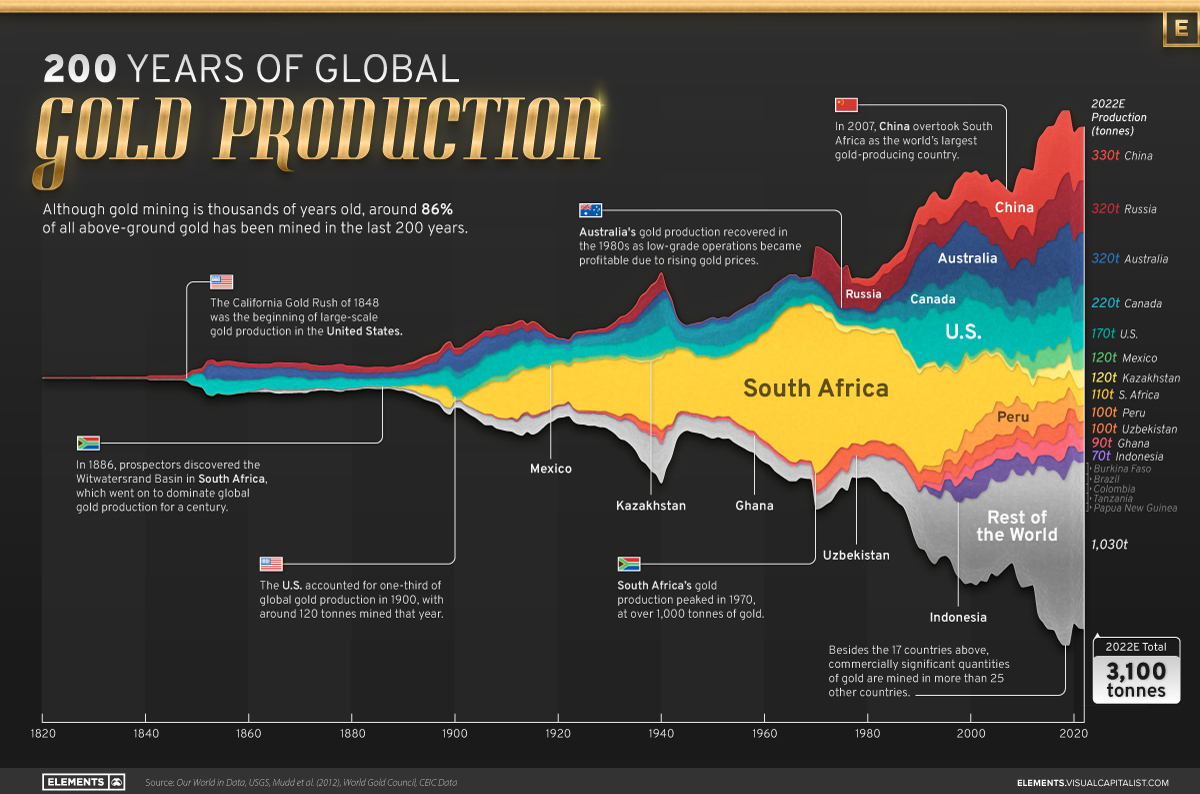
Visualizing Global Gold Production Over 200 Years
This was originally posted on Elements. Sign up to the free mailing list to get beautiful visualizations on natural resource megatrends in your email every week.
Although the practice of gold mining has been around for thousands of years, it’s estimated that roughly 86% of all above-ground gold was extracted in the last 200 years.
With modern mining techniques making large-scale production possible, global gold production has grown exponentially since the 1800s.
The above infographic uses data from Our World in Data to visualize global gold production by country from 1820 to 2022, showing how gold mining has evolved to become increasingly global over time.
A Brief History of Gold Mining
The best-known gold rush in modern history occurred in California in 1848, when James Marshall discovered gold in the Sacramento Valley. As word spread, thousands of migrants flocked to California in search of gold, and by 1855, miners had extracted around $2 billion worth of gold.
The United States, Australia, and Russia were (interchangeably) the three largest gold producers until the 1890s. Then, South Africa took the helm thanks to the massive discovery in the Witwatersrand Basin, now regarded today as one of the world’s greatest ever goldfields.
South Africa’s annual gold production peaked in 1970 at 1,002 tonnes—by far the largest amount of gold produced by any country in a year.
With the price of gold rising since the 1980s, global gold production has become increasingly widespread. By 2007, China was the world’s largest gold-producing nation, and today a significant quantity of gold is being mined in over 40 countries.
The Top Gold-Producing Countries in 2022
Around 31% of the world’s gold production in 2022 came from three countries—China, Russia, and Australia, with each producing over 300 tonnes of the precious metal.
| Rank | Country | 2022E Gold Production, tonnes | % of Total |
|---|---|---|---|
| #1 | 🇨🇳 China | 330 | 11% |
| #2 | 🇷🇺 Russia | 320 | 10% |
| #3 | 🇦🇺 Australia | 320 | 10% |
| #4 | 🇨🇦 Canada | 220 | 7% |
| #5 | 🇺🇸 United States | 170 | 5% |
| #6 | 🇲🇽 Mexico | 120 | 4% |
| #7 | 🇰🇿 Kazakhstan | 120 | 4% |
| #8 | 🇿🇦 South Africa | 110 | 4% |
| #9 | 🇵🇪 Peru | 100 | 3% |
| #10 | 🇺🇿 Uzbekistan | 100 | 3% |
| #11 | 🇬🇭 Ghana | 90 | 3% |
| #12 | 🇮🇩 Indonesia | 70 | 2% |
| - | 🌍 Rest of the World | 1,030 | 33% |
| - | World Total | 3,100 | 100% |
North American countries Canada, the U.S., and Mexico round out the top six gold producers, collectively making up 16% of the global total. The state of Nevada alone accounted for 72% of U.S. production, hosting the world’s largest gold mining complex (including six mines) owned by Nevada Gold Mines.
Meanwhile, South Africa produced 110 tonnes of gold in 2022, down by 74% relative to its output of 430 tonnes in 2000. This long-term decline is the result of mine closures, maturing assets, and industrial conflict, according to the World Gold Council.
Interestingly, two smaller gold producers on the list, Uzbekistan and Indonesia, host the second and third-largest gold mining operations in the world, respectively.
The Outlook for Global Gold Production
Gold prices have been hovering around the $1,900-$2,000 per ounce near all-time highs. For mining companies, higher gold prices can mean more profits per ounce if costs remain unaffected.
According to the World Gold Council, mined gold production is expected to increase in 2023 and could surpass the record set in 2018 (3,300 tonnes), led by the expansion of existing projects in North America. The chances of record mine output could be higher if gold prices continue to increase.


Mining
Visualizing the Copper Investment Opportunity in One Chart
This infographic from Sprott shows how early investors may benefit from the rapidly increasing demand for copper.
Visualizing the Copper Investment Opportunity in One Chart
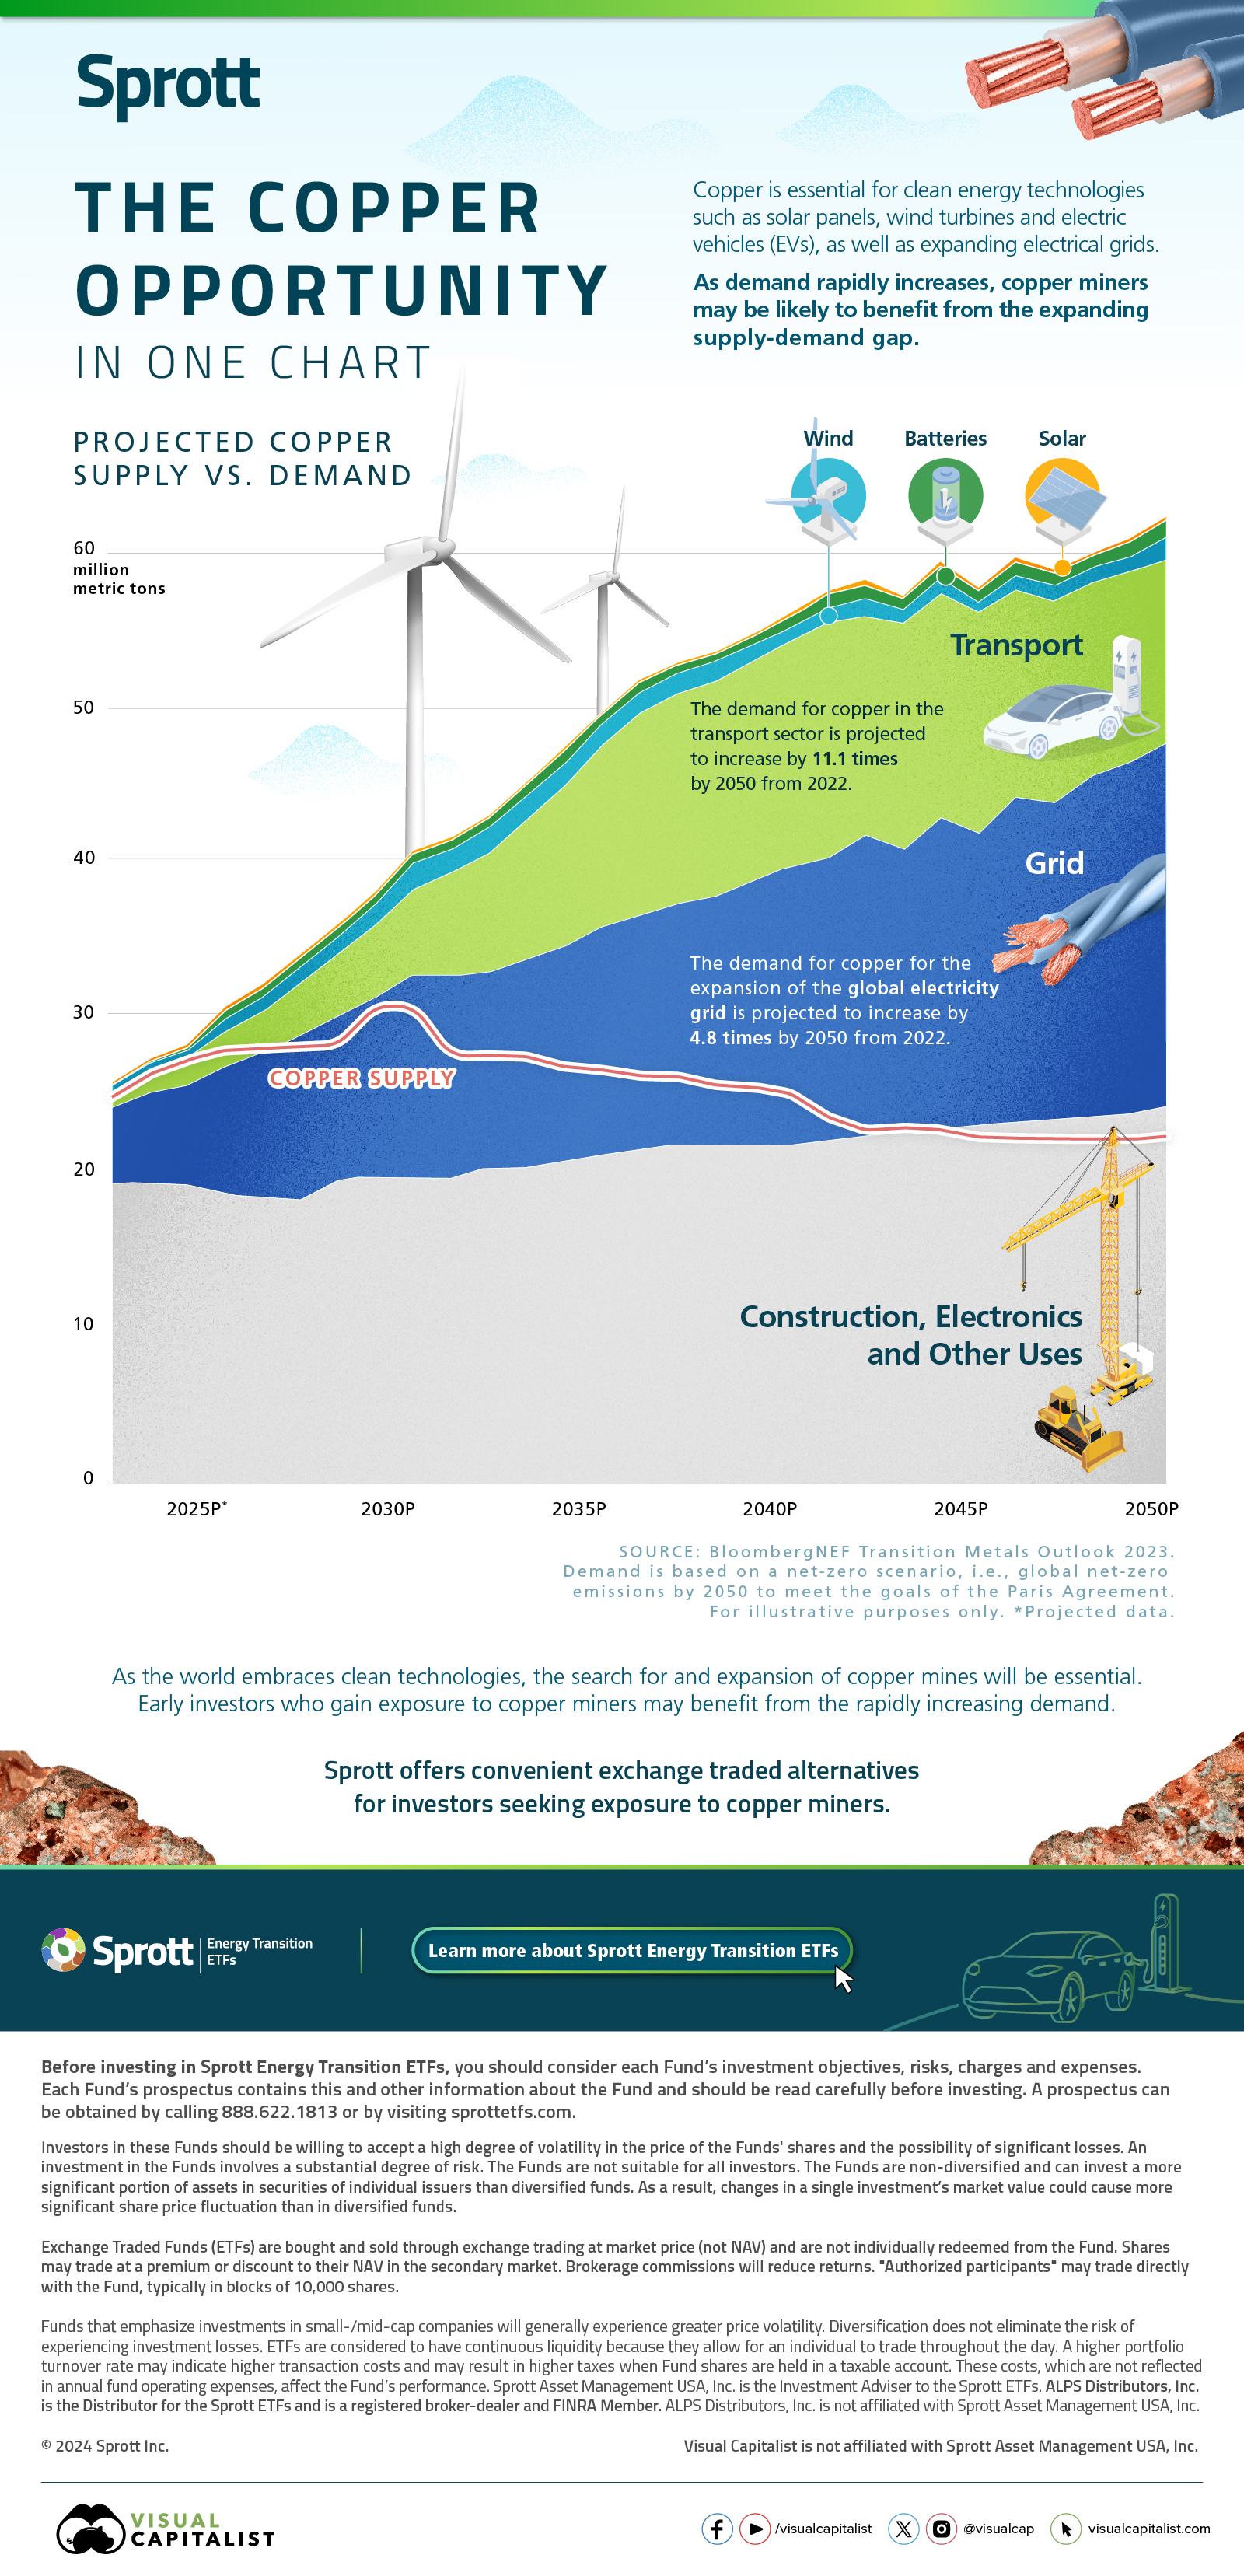
Copper is essential for clean energy applications such as solar panels, wind turbines, and electric vehicles (EVs), as well as for expanding electrical grids.
The surge in demand for the metal, driven by the growing adoption of these technologies, presents a unique investment opportunity for early investors in copper mining companies.
This chart by Sprott explores the growing gap between copper supply and demand until 2050, based on projections from BloombergNEF’s Transition Metals Outlook 2023.
Projected Copper Supply vs. Demand
Copper is naturally abundant on Earth, but extracting the metal at the pace necessary for an electrified economy could be a challenge. The timeline for bringing a copper mine from discovery to production is lengthy, averaging over 16 years.
Top producers like Chile and Peru are facing strikes and protests, along with declining ore grades. Russia, ranked seventh in copper production, faces an expected decline in production due to the ongoing war in Ukraine.
Meanwhile, the increasing adoption of carbon-free technology only highlights copper’s significance.
High Demand for Transport and Electricity Grid
The demand for copper in the transport sector is projected to increase by 11.1 times by 2050, from 2022. EVs, for example, can contain more than a mile of copper wiring.
Additionally, the demand for copper needed to expand the global electricity grid is projected to increase by 4.8 times by 2050, from 2022.
By 2030, the copper supply gap is projected to approach 10 million metric tons, with both copper prices and copper mining stocks potentially set to benefit.
As the world embraces clean technologies, the search for and expansion of copper mines will be essential. Early investors who gain exposure to copper miners may benefit from the rapidly increasing demand.
Sprott offers convenient exchange-traded alternatives for investors seeking exposure to copper miners.
Learn more about Sprott Energy Transition ETFs.

-

 Mining2 days ago
Where the World’s Aluminum is Smelted, by Country
This infographic shows estimated aluminum smelter production by country in 2023, based on data from the USGS.
-

 Mining1 week ago
Visualizing Global Gold Production in 2023
Gold production in 2023 was led by China, Australia, and Russia, with each outputting over 300 tonnes.
-

 Energy2 weeks ago
Ranked: The Top 10 EV Battery Manufacturers in 2023
Asia dominates this ranking of the world’s largest EV battery manufacturers in 2023.
-

 Mining3 weeks ago
Gold vs. S&P 500: Which Has Grown More Over Five Years?
The price of gold has set record highs in 2024, but how has this precious metal performed relative to the S&P 500?
-

 Mining1 month ago
Charted: The Value Gap Between the Gold Price and Gold Miners
While the price of gold has reached new record highs in 2024, gold mining stocks are still far from their 2011 peaks.
-

 Energy3 months ago
Charted: Global Uranium Reserves, by Country
We visualize the distribution of the world’s uranium reserves by country, with 3 countries accounting for more than half of total reserves.

-

 Brands5 days ago
The Evolution of U.S. Beer Logos
-

 Culture2 weeks ago
The World’s Top Media Franchises by All-Time Revenue
-

 voronoi2 weeks ago
Best Visualizations of April on the Voronoi App
-

 Wealth2 weeks ago
Charted: Which Country Has the Most Billionaires in 2024?
-

 Business1 week ago
The Top Private Equity Firms by Country
-

 Markets1 week ago
The Best U.S. Companies to Work for According to LinkedIn
-

 Economy1 week ago
Ranked: The Top 20 Countries in Debt to China
-

 United States1 week ago
Charted: Trust in Government Institutions by G7 Countries