Culture
20 Years of Top Trending Google Searches

20 Years of Top Trending Google Searches
For decades, Google search has been a go-to source for many when looking up directions, keeping up with the news, or seeking information on new and unfamiliar topics.
Today, Google processes about 3.5 billion searches per day. Because of its dominant market share, Google holds a vast archive of keyword searches that, when analyzed, provide an interesting glimpse into the key themes that have captured the world’s attention over the years.
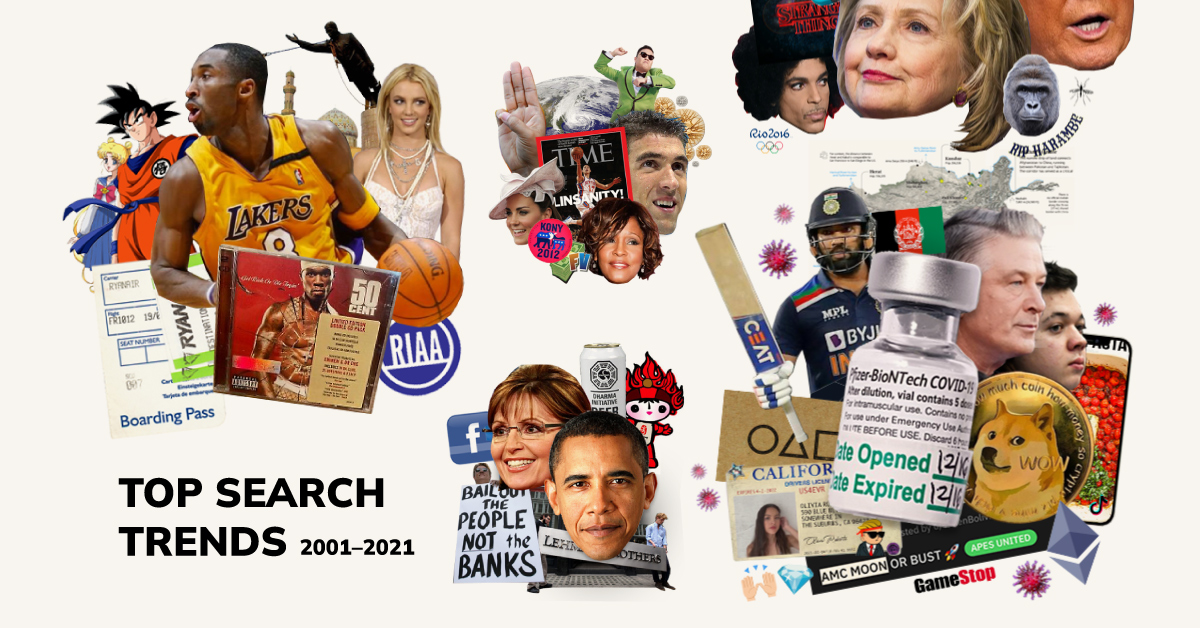
This graphic, using data from Google Trends, goes back 20 years and highlights some of the top keyword searches since 2001.
Our editorial team dug through hundreds of top trending search terms from global and U.S. data and hand-selected their top picks, which are featured in the graphic above.
Trending vs. Volume
Before diving in, it’s worth emphasizing how top trending searches differ from popular searches, which are measured by sheer volume.
Trending searches are terms that have recently spiked in popularity. They focus on growth rather than total volume, and in this dataset, trending terms gauge year-over-year growth.
A good example is Donald Trump, who popped up in the news cycle during the 2016 presidential campaign. After the election, interest in Trump remained high. But his name doesn’t pop up on the Google trends list after 2017, since by that point, search volume for Trump had plateaued.
What are the most popular Google search terms, by volume? To be honest, they’re slightly less interesting than the top trending searches — YouTube is number one, followed by Facebook, then WhatsApp web.
The Globalization of Search Trends
The people and topics featured in Google’s top trends lists evolves as time goes on, reflecting broader adoption of the internet (and Google Search) around the world over time. Early themes are tied to mainstream U.S. pop culture and tech trends.
As time goes on, social media and smartphone adoption increase the granularity and volume of searches, resulting in top trends that are more participatory, diverse, and global in nature.
One final variable to keep in mind is that Google itself began to share more detailed search highlights with each passing year.
Two Decades of Google Searches: Macro Insights
Now that we’ve explained what trending searches actually measure, let’s dig into some of the key themes that have emerged over the last two decades of Google searches.
① People Love Sports
Over the last 20 years, sports have remained a continuous trend.
Every four years, the World Cup shows up as a top trending keyword across the globe. The Olympics also makes a regular appearance, along with Olympic athletes like Michael Phelps and McKayla Maroney.
Although the U.S. dominates the list, particularly when it comes to athletes, there’s still a good variety of international sports that go viral, especially as time goes on. In the last two years, cricket, rugby, and soccer have all made the top five trending lists.
② The Emergence of Celebrity 2.0
Over time, you can also see a transition from the conventional celebrity to celebrity 2.0, also known as the social media celebrity.
In the early 2000s, pop culture icons like Britney Spears, Eminem, and Jennifer Lopez flooded the trending searches, and traditional media forms like TV shows and Movies dominated the mass media categories.
But by 2011, YouTube stars like Rebecca Black started to make their way on the trending search lists. And in 2014, Meme emerged as a top trending category.
This transition nods to a larger shift in media, as digital has gradually overtaken traditional media as the dominant form of entertainment.
③ Natural Disasters are Top of Mind
Natural Disasters are a key trend throughout this data set as well.
Hurricanes are a particularly trendy word, showing up almost half the time—in eight of the 20 years. In 2005, Hurricane Katrina ranked second in the most searched category across the globe.
It continued to gain global attention—by 2006, Hurricane Katrina was still in the top five trending news searches.
Dig Deeper into Trending Google Searches
Our team enjoyed sifting through 20 years of Google data, and we hope you enjoyed this blast from the past too. If you’d like to dive deeper, you can explore Google’s full dataset here.
Happy searching.
Automotive
How People Get Around in America, Europe, and Asia
Examining how people get around using cars, public transit, and walking or biking, and the regional differences in usage.
How People Get Around in America, Europe, and Asia
This was originally posted on our Voronoi app. Download the app for free on iOS or Android and discover incredible data-driven charts from a variety of trusted sources.
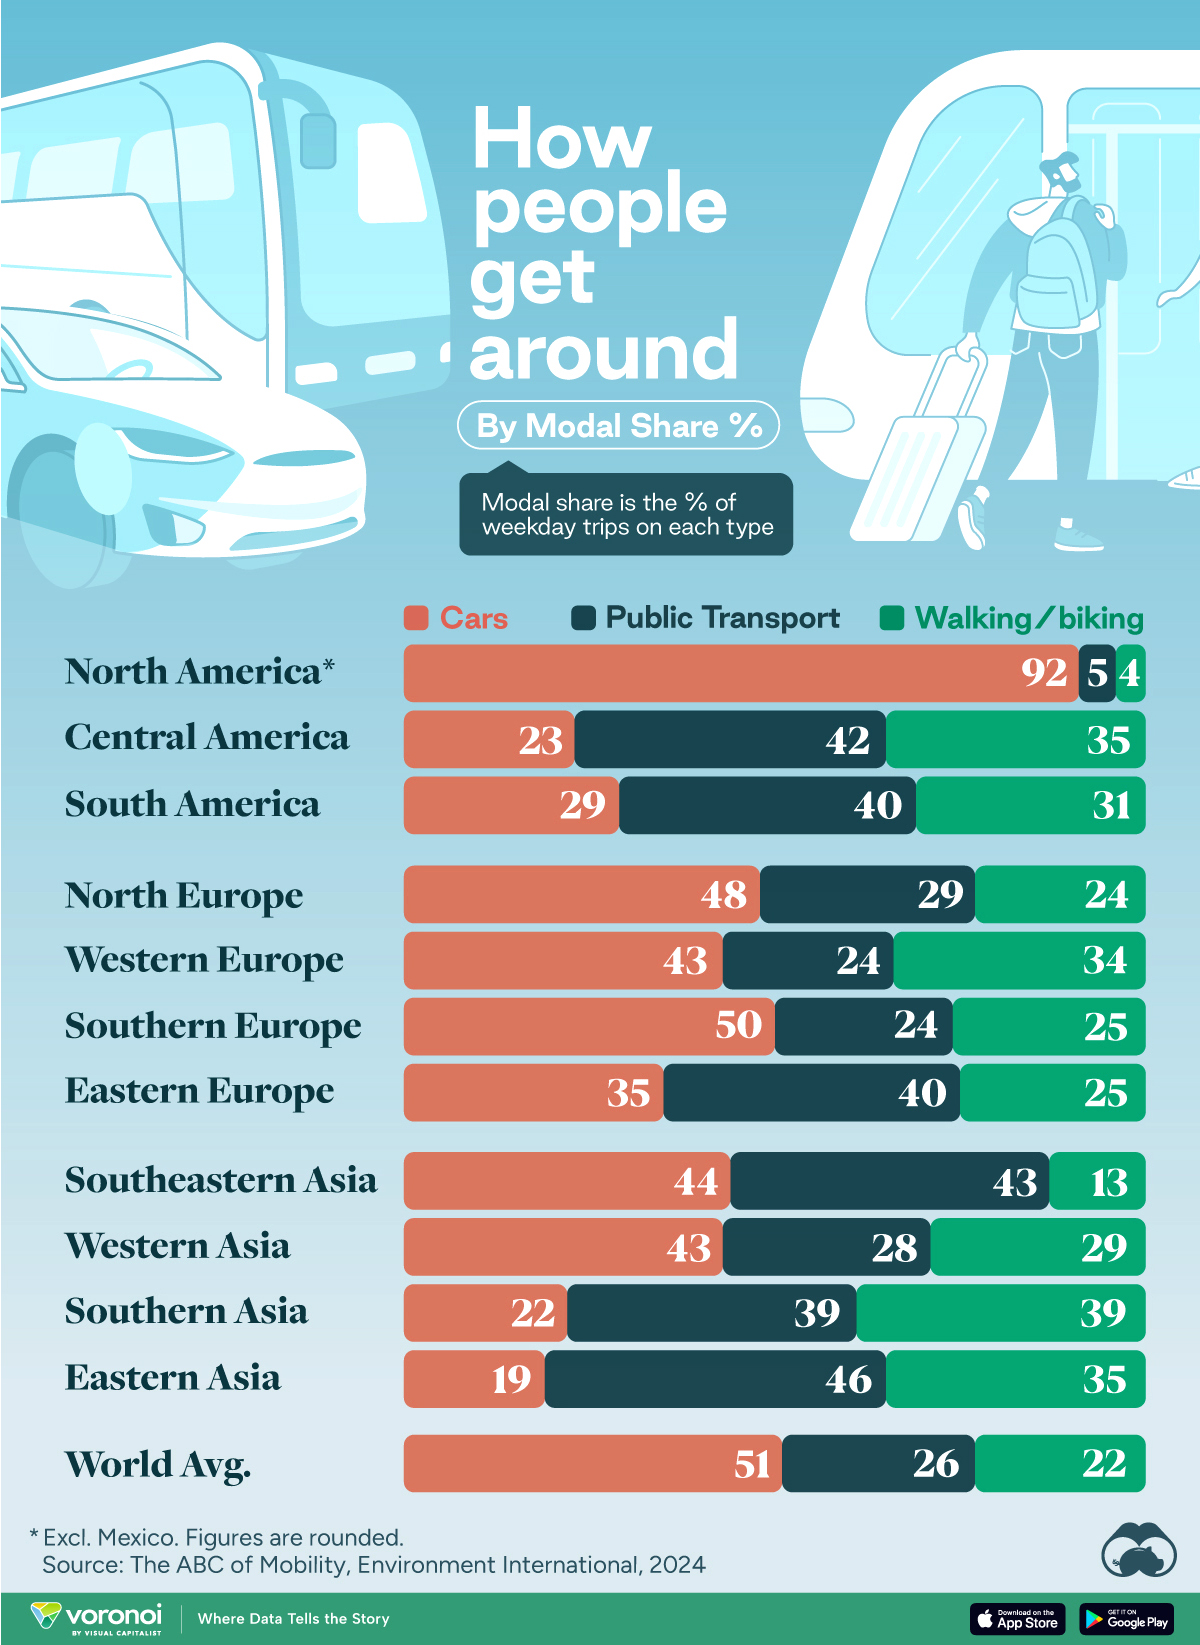
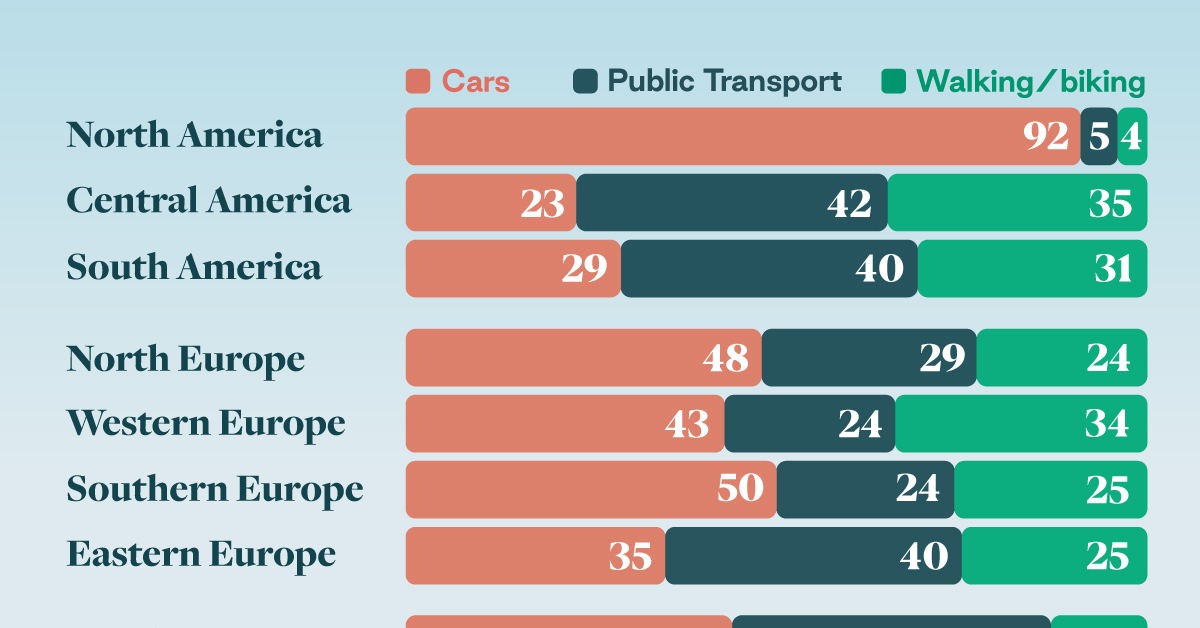
This chart highlights the popularity of different transportation types in the Americas, Europe, and Asia, calculated by modal share.
Data for this article and visualization is sourced from ‘The ABC of Mobility’, a research paper by Rafael Prieto-Curiel (Complexity Science Hub) and Juan P. Ospina (EAFIT University), accessed through ScienceDirect.
The authors gathered their modal share data through travel surveys, which focused on the primary mode of transportation a person employs for each weekday trip. Information from 800 cities across 61 countries was collected for this study.
North American Car Culture Contrasts with the Rest of the World
In the U.S. and Canada, people heavily rely on cars to get around, no matter the size of the city. There are a few exceptions of course, such as New York, Toronto, and smaller college towns across the United States.
| Region | 🚗 Cars | 🚌 Public Transport | 🚶 Walking/Biking |
|---|---|---|---|
| North America* | 92% | 5% | 4% |
| Central America | 23% | 42% | 35% |
| South America | 29% | 40% | 31% |
| Northern Europe | 48% | 29% | 24% |
| Western Europe | 43% | 24% | 34% |
| Southern Europe | 50% | 24% | 25% |
| Eastern Europe | 35% | 40% | 25% |
| Southeastern Asia | 44% | 43% | 13% |
| Western Asia | 43% | 28% | 29% |
| Southern Asia | 22% | 39% | 39% |
| Eastern Asia | 19% | 46% | 35% |
| World | 51% | 26% | 22% |
Note: *Excluding Mexico. Percentages are rounded.
As a result, North America’s share of public transport and active mobility (walking and biking) is the lowest amongst all surveyed regions by a significant amount.
On the other hand, public transport reigns supreme in South and Central America as well as Southern and Eastern Asia. It ties with cars in Southeastern Asia, and is eclipsed by cars in Western Asia.
As outlined in the paper, Europe sees more city-level differences in transport popularity.
For example, Utrecht, Netherlands prefers walking and biking. People in Paris and London like using their extensive transit systems. And in Manchester and Rome, roughly two out of three journeys are by car.
-

 Healthcare4 days ago
What Causes Preventable Child Deaths?
-

 voronoi2 weeks ago
Best Visualizations of April on the Voronoi App
-

 Wealth2 weeks ago
Charted: Which Country Has the Most Billionaires in 2024?
-

 Markets1 week ago
The Top Private Equity Firms by Country
-

 Jobs1 week ago
The Best U.S. Companies to Work for According to LinkedIn
-

 Economy1 week ago
Ranked: The Top 20 Countries in Debt to China
-

 Politics1 week ago
Charted: Trust in Government Institutions by G7 Countries
-

 Energy1 week ago
Mapped: The Age of Energy Projects in Interconnection Queues, by State

