Technology
The 150 Apps that Power the Gig Economy
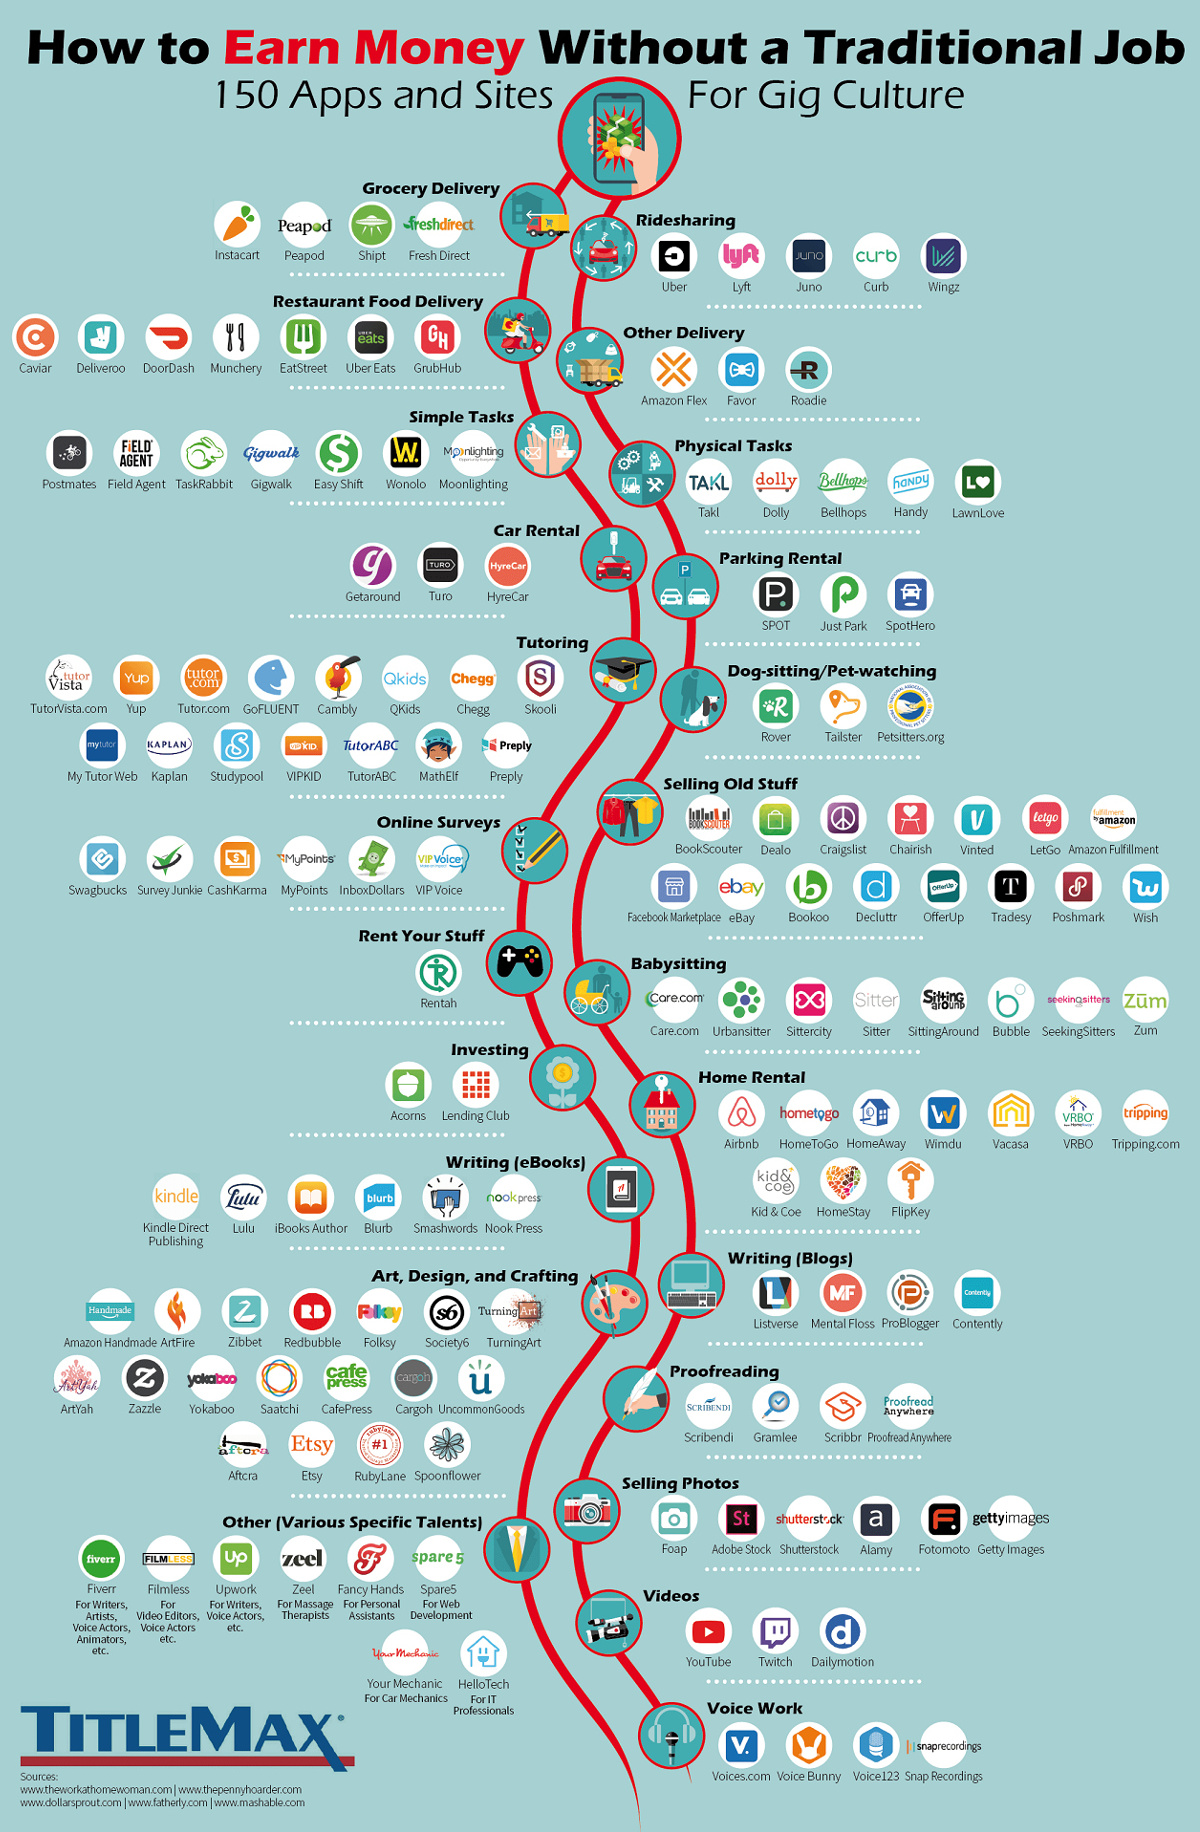
Here are 150 Apps that Power the Gig Economy
Go back in time a decade, and you’d have a tough time convincing anyone that they would be “employed” through an app on their phone.
And yet, in a short period of time, the emergence of the smartphone has enabled the gig economy to flourish into a multi-trillion dollar global market. And by leveraging apps like Uber, Airbnb, and Etsy, it’s estimated that 57 million people in the U.S. now participate in the gig economy each year in some shape or form.
What apps do these people use to turn their time, skills, hobbies, or assets (cars, home, parking spaces, etc.) into additional income streams?
App Examples
Today’s infographic comes to us from TitleMax, and it lists 150 different apps that are used within the gig economy – including many that pay gig workers directly.
Here are just some of the apps that are used in some of the major categories above:
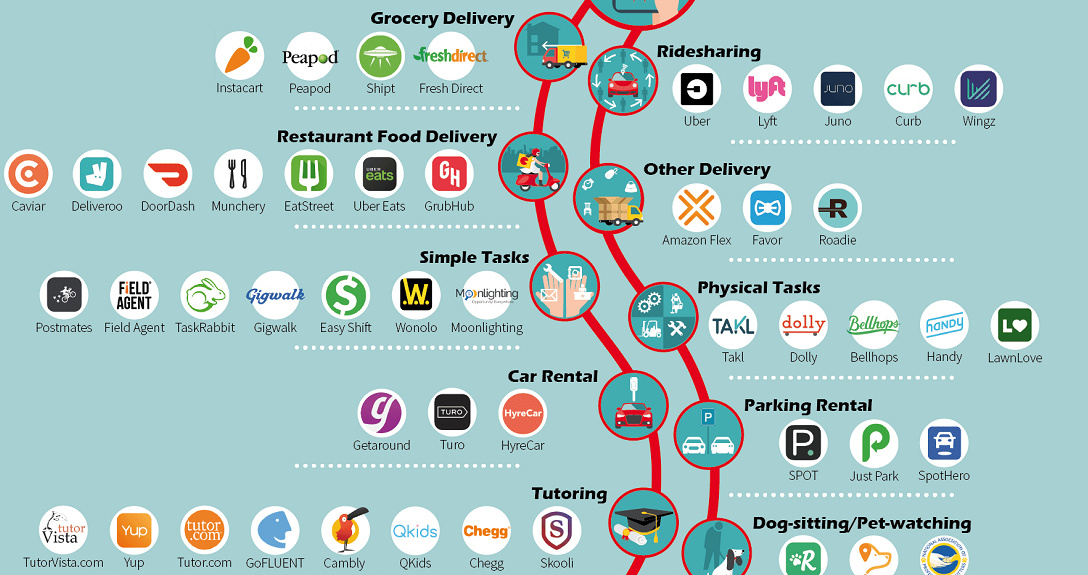
Ridesharing
Uber and Lyft are what many think of when they hear about the gig economy. However, there are now dozens of rideshare apps out there to fill different niches – for example, Wingz offers flat-fee rides to the airport, while Curb connects riders with professional taxi drivers.
Errands
TaskRabbit, which was bought by IKEA, turns errands such as assembling furniture or cleaning a gutter into payable gigs. Meanwhile, apps like Dolly and Bellhops will connect you with movers, and LawnLove is for lawn care.
Art, Design, and Crafting
Etsy, a marketplace for handmade goods, is one the of the best known brands in this category. However, there are many other niche options here as well – for example, UncommonGoods specializes in unique gifts, while Society6 focuses on gallery quality art prints.
Writing and Editing
Lulu and Kindle Direct allow you to publish eBooks online and sell them, while proofreaders and editors can get paid for their copy editing services through Gramlee.
Delivery
Fast and efficient delivery services are a centerpiece to the gig economy, and there are no shortage of options here. DoorDash, UberEats, Caviar, and GrubHub allow users to get food delivered to their doors, while apps like Instacart focus on grocery delivery.
Multimedia
We all know that you can create videos and monetize them on places like YouTube or Twitch, but did you know you can be a voice actor through services like VoiceBunny? You can also sell rights to your photos via Foap, or do freelancing work through Upwork or Fiverr.
Whether you are tapping into the gig economy for an extra income stream or you are incorporating gig economy services into your life for added convenience, there is no shortage of options to choose from.


Technology
All of the Grants Given by the U.S. CHIPS Act
Intel, TSMC, and more have received billions in subsidies from the U.S. CHIPS Act in 2024.


All of the Grants Given by the U.S. CHIPS Act
This was originally posted on our Voronoi app. Download the app for free on iOS or Android and discover incredible data-driven charts from a variety of trusted sources.
This visualization shows which companies are receiving grants from the U.S. CHIPS Act, as of April 25, 2024. The CHIPS Act is a federal statute signed into law by President Joe Biden that authorizes $280 billion in new funding to boost domestic research and manufacturing of semiconductors.
The grant amounts visualized in this graphic are intended to accelerate the production of semiconductor fabrication plants (fabs) across the United States.
Data and Company Highlights
The figures we used to create this graphic were collected from a variety of public news sources. The Semiconductor Industry Association (SIA) also maintains a tracker for CHIPS Act recipients, though at the time of writing it does not have the latest details for Micron.
| Company | Federal Grant Amount | Anticipated Investment From Company |
|---|---|---|
| 🇺🇸 Intel | $8,500,000,000 | $100,000,000,000 |
| 🇹🇼 TSMC | $6,600,000,000 | $65,000,000,000 |
| 🇰🇷 Samsung | $6,400,000,000 | $45,000,000,000 |
| 🇺🇸 Micron | $6,100,000,000 | $50,000,000,000 |
| 🇺🇸 GlobalFoundries | $1,500,000,000 | $12,000,000,000 |
| 🇺🇸 Microchip | $162,000,000 | N/A |
| 🇬🇧 BAE Systems | $35,000,000 | N/A |
BAE Systems was not included in the graphic due to size limitations
Intel’s Massive Plans
Intel is receiving the largest share of the pie, with $8.5 billion in grants (plus an additional $11 billion in government loans). This grant accounts for 22% of the CHIPS Act’s total subsidies for chip production.
From Intel’s side, the company is expected to invest $100 billion to construct new fabs in Arizona and Ohio, while modernizing and/or expanding existing fabs in Oregon and New Mexico. Intel could also claim another $25 billion in credits through the U.S. Treasury Department’s Investment Tax Credit.
TSMC Expands its U.S. Presence
TSMC, the world’s largest semiconductor foundry company, is receiving a hefty $6.6 billion to construct a new chip plant with three fabs in Arizona. The Taiwanese chipmaker is expected to invest $65 billion into the project.
The plant’s first fab will be up and running in the first half of 2025, leveraging 4 nm (nanometer) technology. According to TrendForce, the other fabs will produce chips on more advanced 3 nm and 2 nm processes.
The Latest Grant Goes to Micron
Micron, the only U.S.-based manufacturer of memory chips, is set to receive $6.1 billion in grants to support its plans of investing $50 billion through 2030. This investment will be used to construct new fabs in Idaho and New York.

-

 Debt1 week ago
How Debt-to-GDP Ratios Have Changed Since 2000
-

 Markets2 weeks ago
Ranked: The World’s Top Flight Routes, by Revenue
-

 Countries2 weeks ago
Population Projections: The World’s 6 Largest Countries in 2075
-

 Markets2 weeks ago
The Top 10 States by Real GDP Growth in 2023
-

 Demographics2 weeks ago
The Smallest Gender Wage Gaps in OECD Countries
-

 United States2 weeks ago
Where U.S. Inflation Hit the Hardest in March 2024
-

 Green2 weeks ago
Top Countries By Forest Growth Since 2001
-

 United States2 weeks ago
Ranked: The Largest U.S. Corporations by Number of Employees