Markets
Animation: The Earnings of the Biggest Movie Franchises Over the Last 20 Years
Note: The Numbers defines North America as the United States, Canada, Puerto Rico and Guam. The data here does not cover all of the top-grossing movie franchises.
Animation: The Earnings of the Biggest Movie Franchises Over the Last 20 Years
From Iron Man to Luke Skywalker, viewers love watching their favorite heroes triumph over evil time and time again. These successful movie franchises have won our hearts, and padded film studios’ wallets in the process.
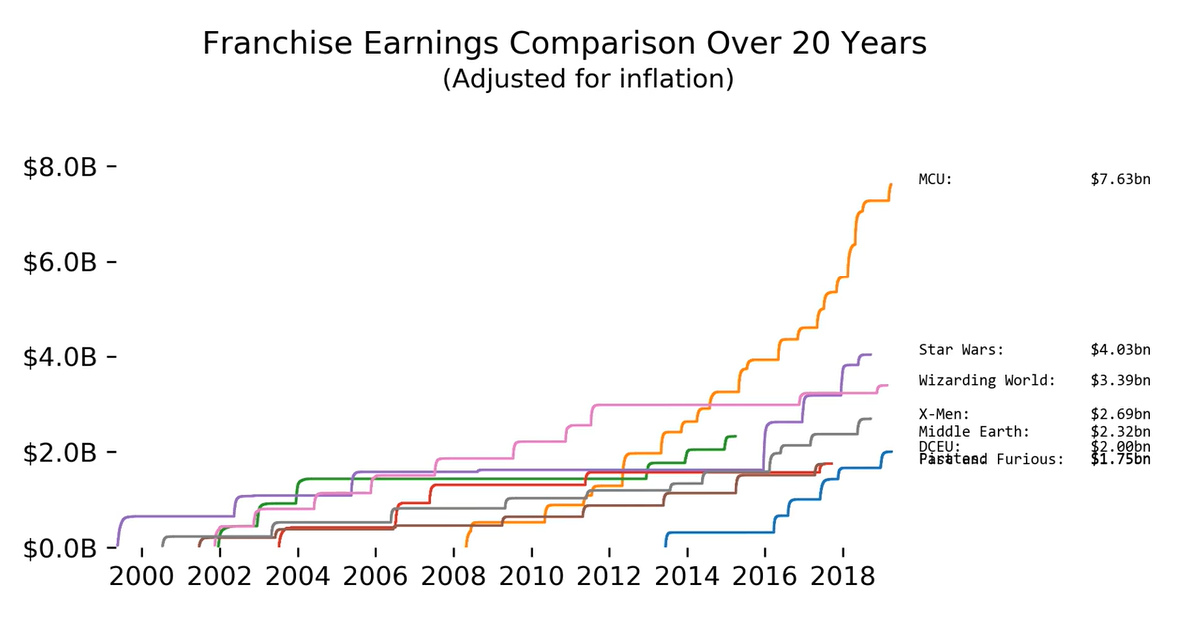
Today’s animation comes from Reddit user /u/rebellious_scum and it charts North American box office sales for select movie franchises, as reported by movie data website The Numbers. The daily ticket earnings were captured from May 19, 1999 (release date of Star Wars: Episode I) to April 4, 2019 and adjusted for inflation.
What stands out the most?
The clear takeaway from the animation is Marvel’s exponential earnings growth since it debuted with Iron Man in 2008.
As of April 4, the franchise had earned inflation-adjusted revenue of $7.63 billion – almost double that of runner-up Star Wars, which totaled $4.03 billion. Of course, this does not take into account data from the record-shattering release of Avengers: Endgame on April 26th, which would skew numbers in Marvel’s favor even more.
Average Revenue Per Movie
While these numbers sound impressive, what’s the average revenue each movie has generated in North America?
Using the animation’s inflation-adjusted numbers, here’s how it all breaks down:
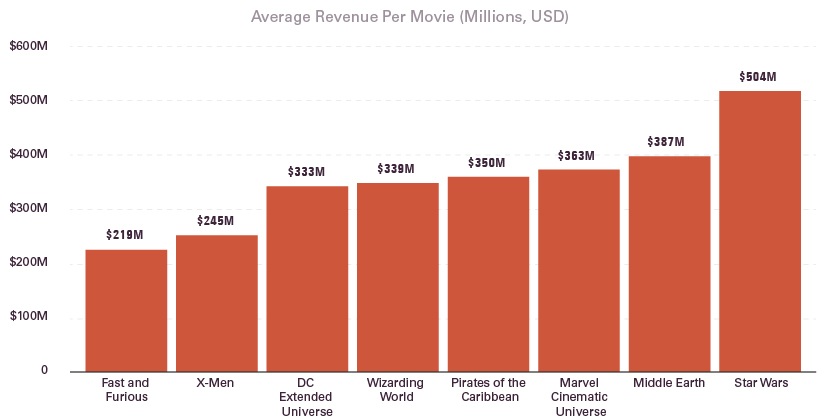
Star Wars and Middle Earth top the list in terms of average revenue per movie. Meanwhile, Marvel lands in third place and is closely followed by Pirates of the Caribbean, the Wizarding World, and the DC Extended Universe (DCEU).
Compared to direct competitor DCEU, Marvel earns roughly $30 million more per movie.
The Rate of Movie Production
The secret, in part, to Marvel’s astronomical surge?
They produce movies at breakneck speed. The studio knows it has a winning recipe, and cooks up movies quickly to stay fresh in viewers’ minds.
In twelve years, Marvel Studios has produced 22 movies including Avengers: Endgame. By comparison, the giant James Bond franchise has produced 24 movies since its inception 57 years ago in 1962.
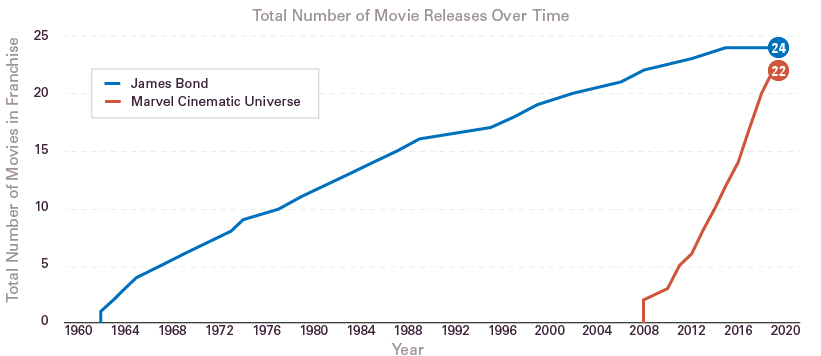
Source: 007.com, Marvel.com
The Market Share Leaders
With Disney’s recent purchase of Fox, the ownership of movie franchises became even more concentrated.
Today, Hollywood essentially has three parent companies: The Walt Disney Company, Universal/Comcast Corp., and WarnerMedia (previously TimeWarner).
Here’s who owns the above eight franchises:
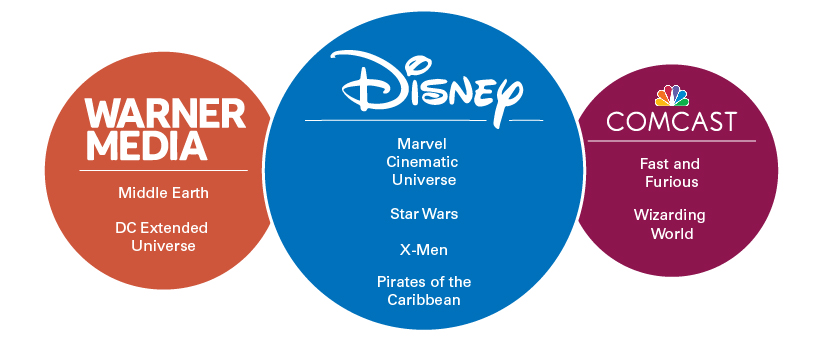
Sources: Business Insider, Forbes, Fortune, The Tolkien Society
Disney is a major player in the franchise space, and shows no signs of slowing down. There are even talks that the company is looking to reboot the Pirates of the Caribbean franchise.
In an industry full of risk, studios are looking to capitalize on a winning franchise formula: build a trusted brand with beloved characters, and produce movies as fast as time will allow.


Markets
U.S. Debt Interest Payments Reach $1 Trillion
U.S. debt interest payments have surged past the $1 trillion dollar mark, amid high interest rates and an ever-expanding debt burden.


U.S. Debt Interest Payments Reach $1 Trillion
This was originally posted on our Voronoi app. Download the app for free on iOS or Android and discover incredible data-driven charts from a variety of trusted sources.
The cost of paying for America’s national debt crossed the $1 trillion dollar mark in 2023, driven by high interest rates and a record $34 trillion mountain of debt.
Over the last decade, U.S. debt interest payments have more than doubled amid vast government spending during the pandemic crisis. As debt payments continue to soar, the Congressional Budget Office (CBO) reported that debt servicing costs surpassed defense spending for the first time ever this year.
This graphic shows the sharp rise in U.S. debt payments, based on data from the Federal Reserve.
A $1 Trillion Interest Bill, and Growing
Below, we show how U.S. debt interest payments have risen at a faster pace than at another time in modern history:
| Date | Interest Payments | U.S. National Debt |
|---|---|---|
| 2023 | $1.0T | $34.0T |
| 2022 | $830B | $31.4T |
| 2021 | $612B | $29.6T |
| 2020 | $518B | $27.7T |
| 2019 | $564B | $23.2T |
| 2018 | $571B | $22.0T |
| 2017 | $493B | $20.5T |
| 2016 | $460B | $20.0T |
| 2015 | $435B | $18.9T |
| 2014 | $442B | $18.1T |
| 2013 | $425B | $17.2T |
| 2012 | $417B | $16.4T |
| 2011 | $433B | $15.2T |
| 2010 | $400B | $14.0T |
| 2009 | $354B | $12.3T |
| 2008 | $380B | $10.7T |
| 2007 | $414B | $9.2T |
| 2006 | $387B | $8.7T |
| 2005 | $355B | $8.2T |
| 2004 | $318B | $7.6T |
| 2003 | $294B | $7.0T |
| 2002 | $298B | $6.4T |
| 2001 | $318B | $5.9T |
| 2000 | $353B | $5.7T |
| 1999 | $353B | $5.8T |
| 1998 | $360B | $5.6T |
| 1997 | $368B | $5.5T |
| 1996 | $362B | $5.3T |
| 1995 | $357B | $5.0T |
| 1994 | $334B | $4.8T |
| 1993 | $311B | $4.5T |
| 1992 | $306B | $4.2T |
| 1991 | $308B | $3.8T |
| 1990 | $298B | $3.4T |
| 1989 | $275B | $3.0T |
| 1988 | $254B | $2.7T |
| 1987 | $240B | $2.4T |
| 1986 | $225B | $2.2T |
| 1985 | $219B | $1.9T |
| 1984 | $205B | $1.7T |
| 1983 | $176B | $1.4T |
| 1982 | $157B | $1.2T |
| 1981 | $142B | $1.0T |
| 1980 | $113B | $930.2B |
| 1979 | $96B | $845.1B |
| 1978 | $84B | $789.2B |
| 1977 | $69B | $718.9B |
| 1976 | $61B | $653.5B |
| 1975 | $55B | $576.6B |
| 1974 | $50B | $492.7B |
| 1973 | $45B | $469.1B |
| 1972 | $39B | $448.5B |
| 1971 | $36B | $424.1B |
| 1970 | $35B | $389.2B |
| 1969 | $30B | $368.2B |
| 1968 | $25B | $358.0B |
| 1967 | $23B | $344.7B |
| 1966 | $21B | $329.3B |
Interest payments represent seasonally adjusted annual rate at the end of Q4.
At current rates, the U.S. national debt is growing by a remarkable $1 trillion about every 100 days, equal to roughly $3.6 trillion per year.
As the national debt has ballooned, debt payments even exceeded Medicaid outlays in 2023—one of the government’s largest expenditures. On average, the U.S. spent more than $2 billion per day on interest costs last year. Going further, the U.S. government is projected to spend a historic $12.4 trillion on interest payments over the next decade, averaging about $37,100 per American.
Exacerbating matters is that the U.S. is running a steep deficit, which stood at $1.1 trillion for the first six months of fiscal 2024. This has accelerated due to the 43% increase in debt servicing costs along with a $31 billion dollar increase in defense spending from a year earlier. Additionally, a $30 billion increase in funding for the Federal Deposit Insurance Corporation in light of the regional banking crisis last year was a major contributor to the deficit increase.
Overall, the CBO forecasts that roughly 75% of the federal deficit’s increase will be due to interest costs by 2034.

-

 Real Estate2 weeks ago
Visualizing America’s Shortage of Affordable Homes
-

 Technology1 week ago
Ranked: Semiconductor Companies by Industry Revenue Share
-

 Money2 weeks ago
Which States Have the Highest Minimum Wage in America?
-

 Real Estate2 weeks ago
Ranked: The Most Valuable Housing Markets in America
-

 Business2 weeks ago
Charted: Big Four Market Share by S&P 500 Audits
-

 AI2 weeks ago
The Stock Performance of U.S. Chipmakers So Far in 2024
-

 Misc2 weeks ago
Almost Every EV Stock is Down After Q1 2024
-

 Money2 weeks ago
Where Does One U.S. Tax Dollar Go?