Mining
11 Stunning Visualizations of Gold Show Its Value and Rarity
The Money Project is an ongoing collaboration between Visual Capitalist and Texas Precious Metals that seeks to use intuitive visualizations to explore the origins, nature, and use of money.
Since Ancient times, gold has served a very unique function in society.
Gold is extremely rare, impossible to create out of “thin air”, easily identifiable, malleable, and it does not tarnish. By nature of these properties, gold has been highly valued throughout history for every tiny ounce of weight. That’s why it’s been used by people for centuries as a monetary metal, a symbol of wealth, and a store of value.
Visualizing Gold’s Value and Rarity
With all that value coming from such a small package, sometimes it is hard to put gold’s immense worth into context.
The following 11 images help to capture this about gold, putting things into better perspective.
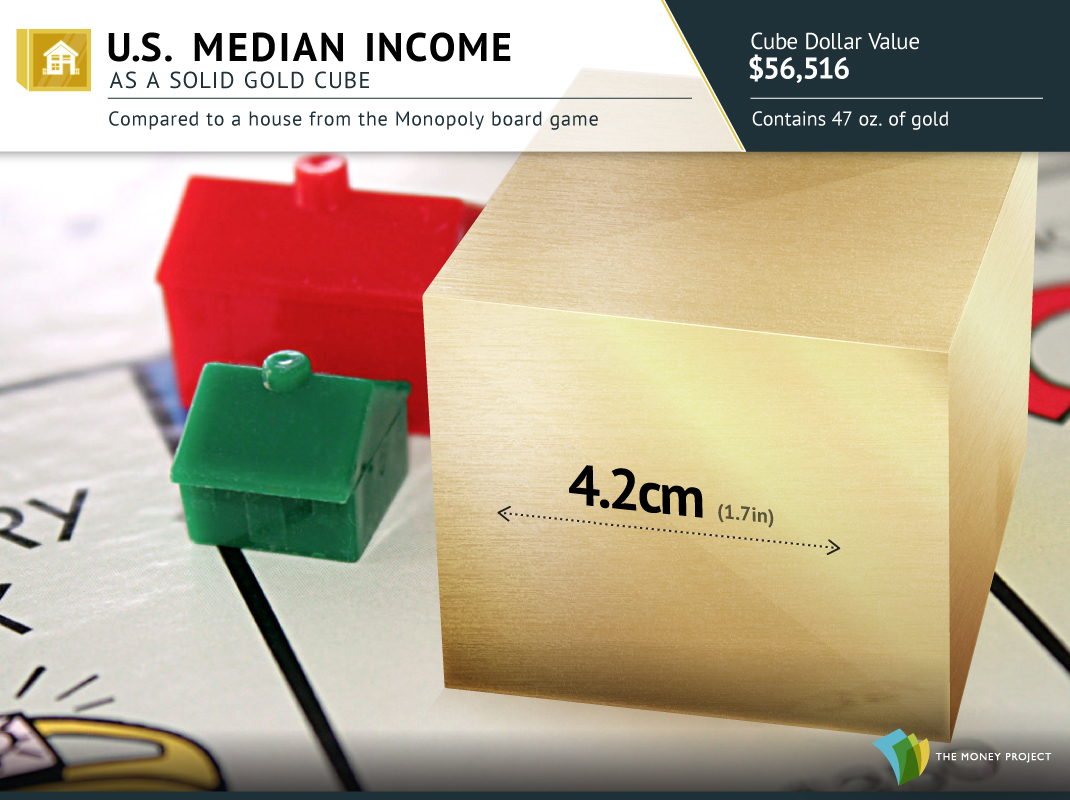
1. The U.S. median income, as a gold cube, easily fits in the palm of your hand.
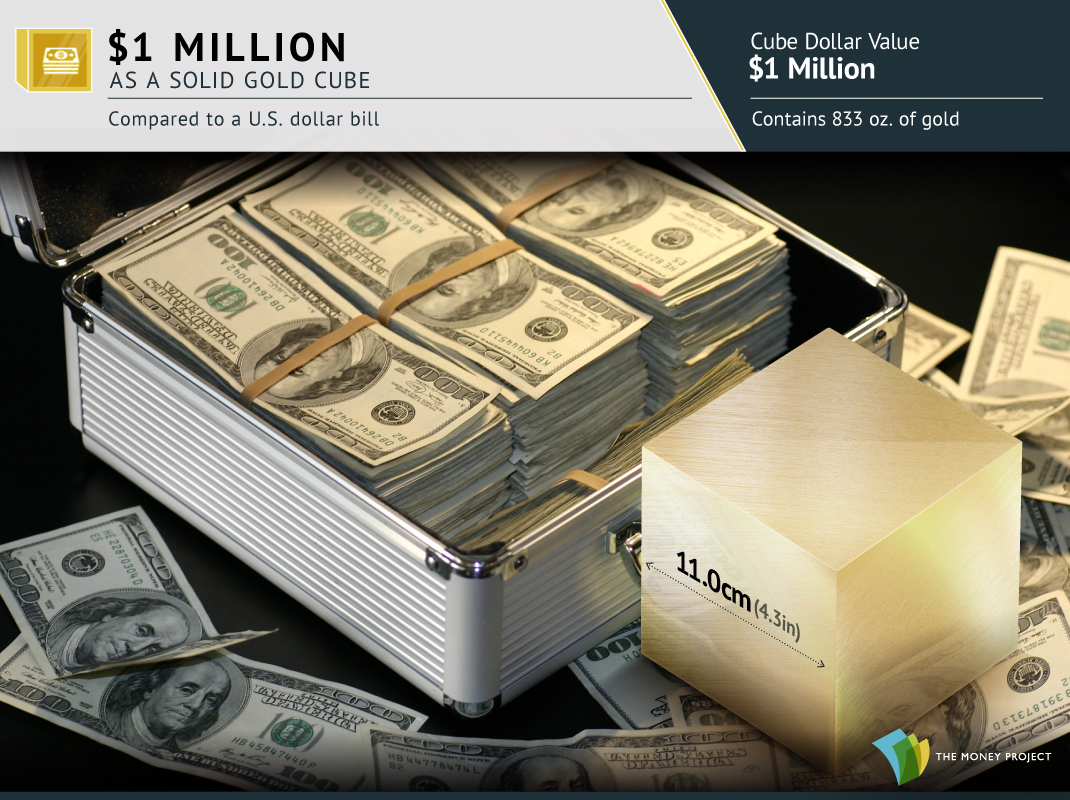
2. A gold cube worth $1 million, has sides that are 2/3 the length of a typical banknote.
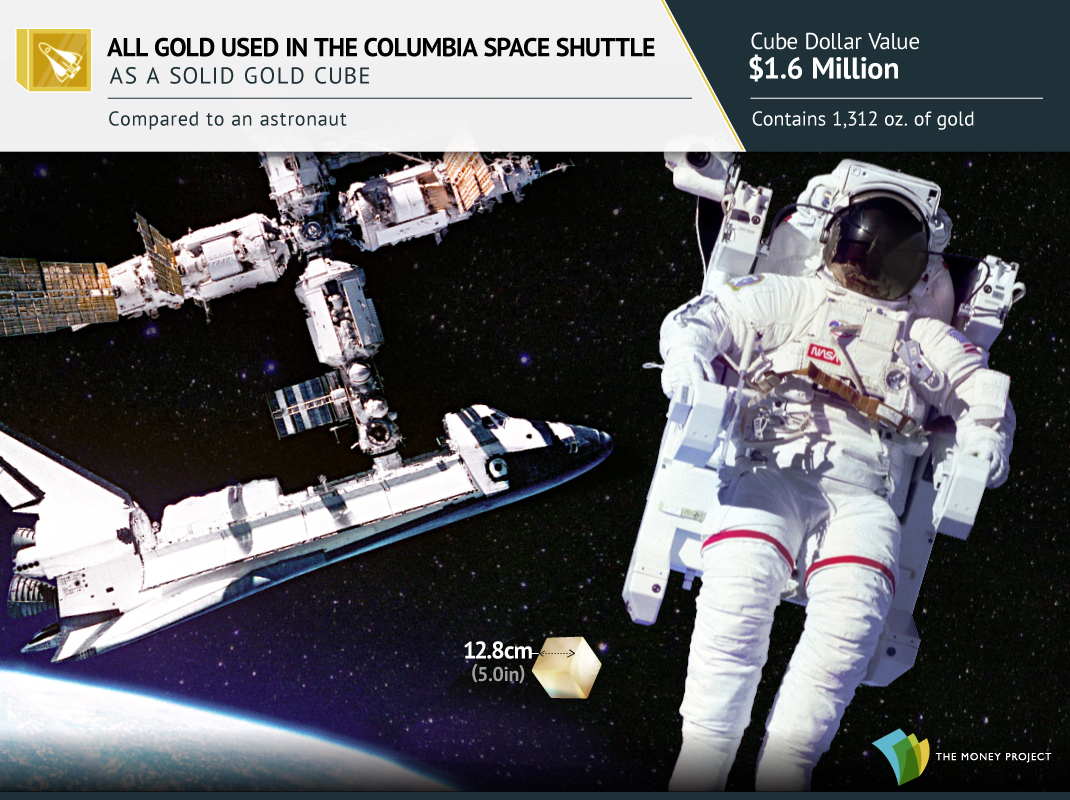
3. All gold used for electrical connections in the Columbia Space Shuttle would be worth $1.6 million today.
4. Trump’s entire fortune of $3.7 billion as a gold cube would be shorter than Trump himself.

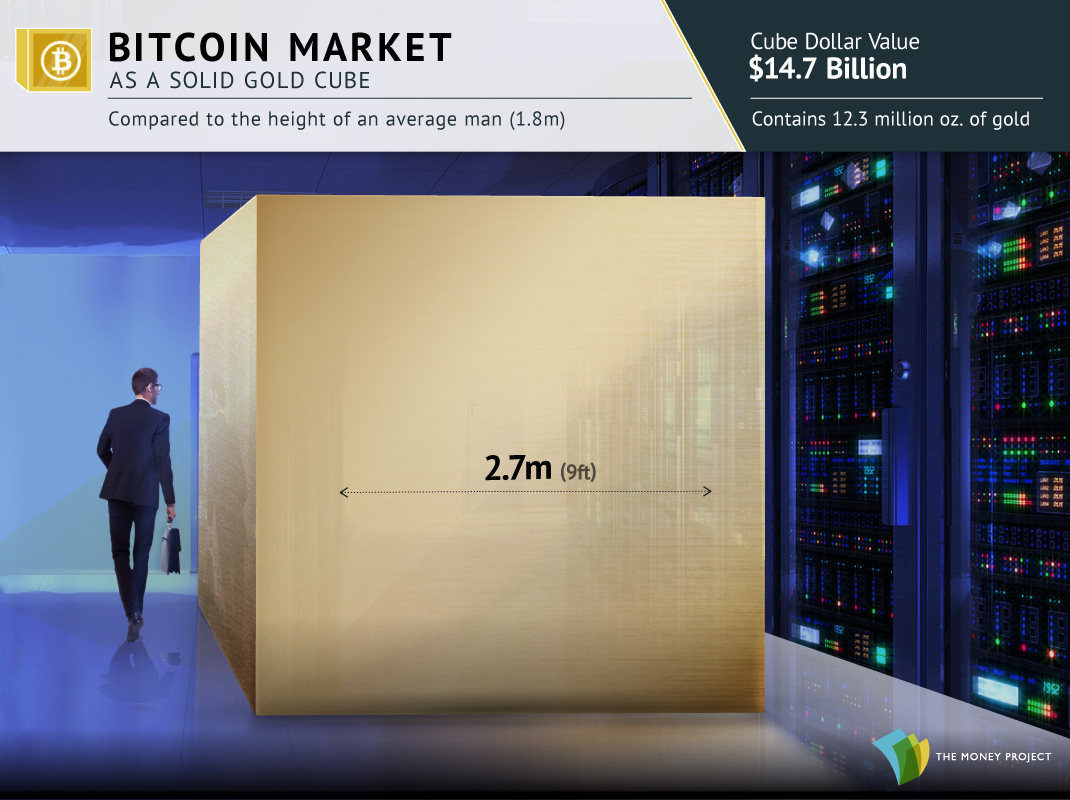
5. As a gold cube, the entire value of the Bitcoin market would fit in a hallway.
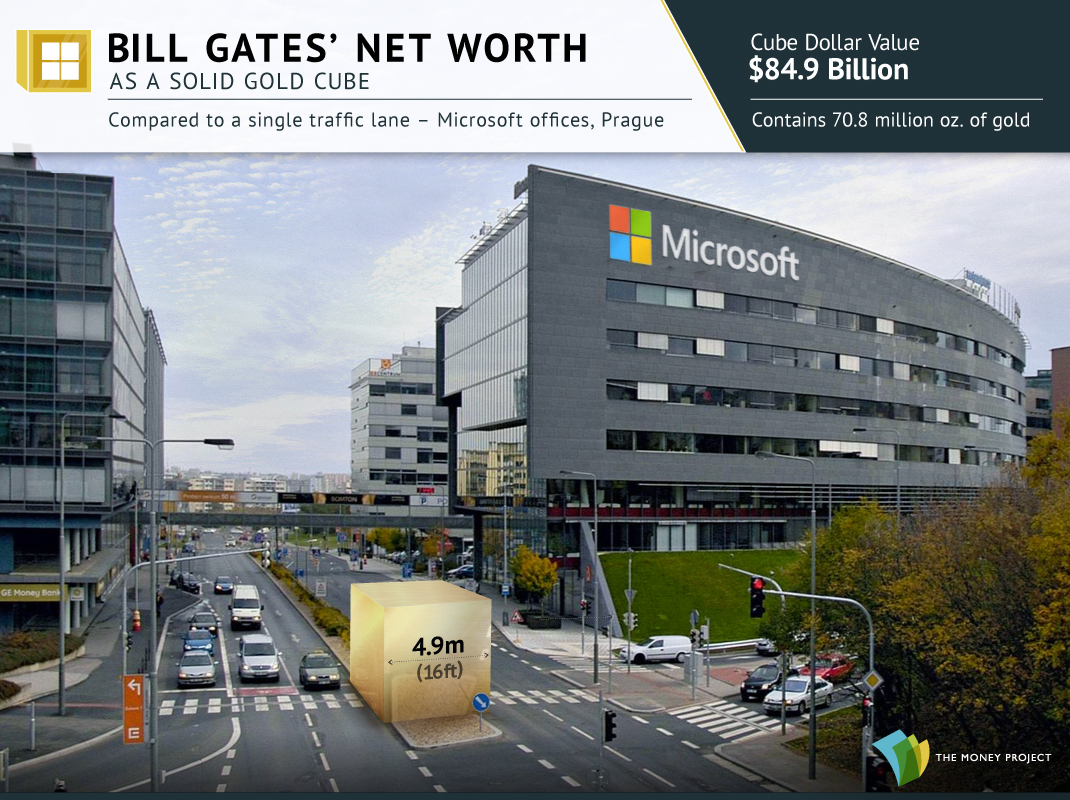
6. The fortune of the richest man on Earth, Bill Gates, would take up a single traffic lane.
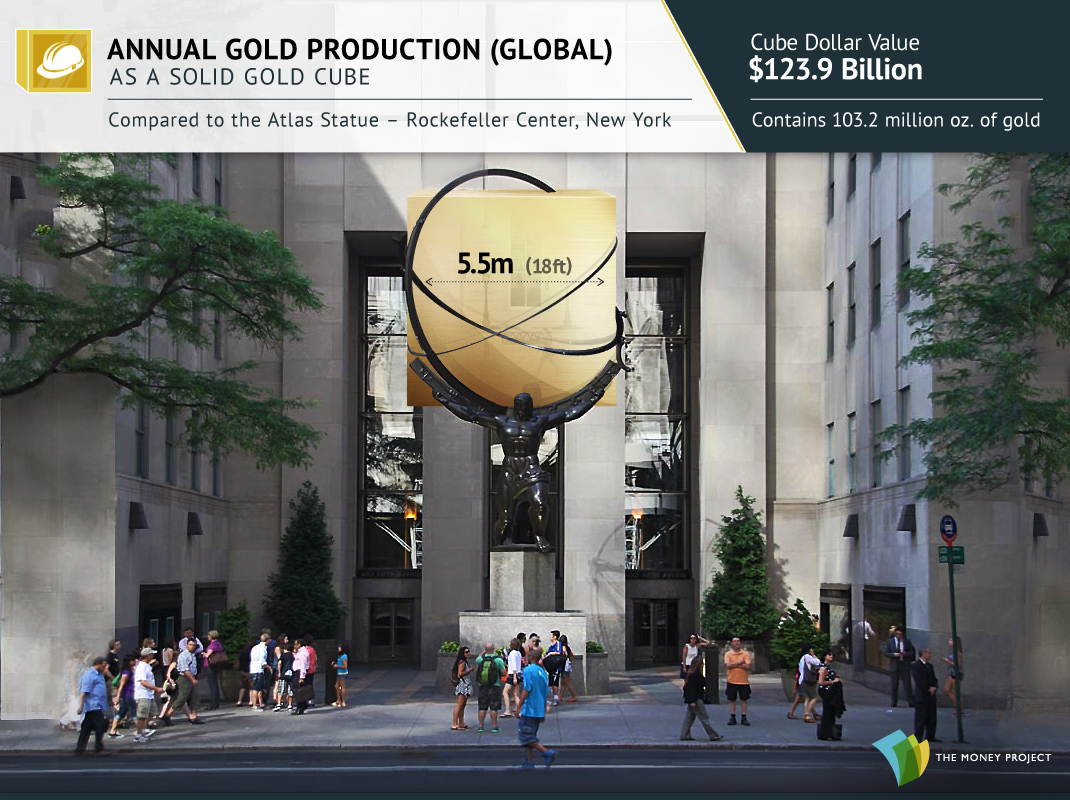
7. The world’s entire annual production of gold is just a 5.5m sided (18 ft) cube.
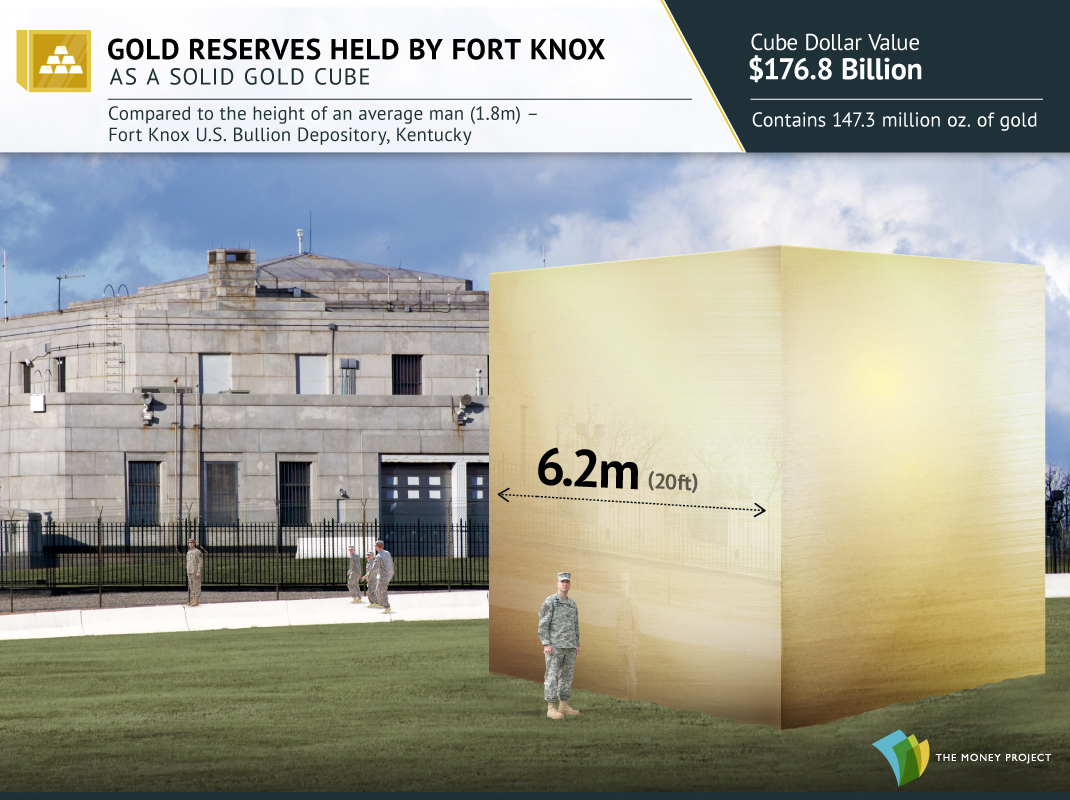
8. Take the 147.3 million oz of gold out of Fort Knox, and it’s only slightly bigger.
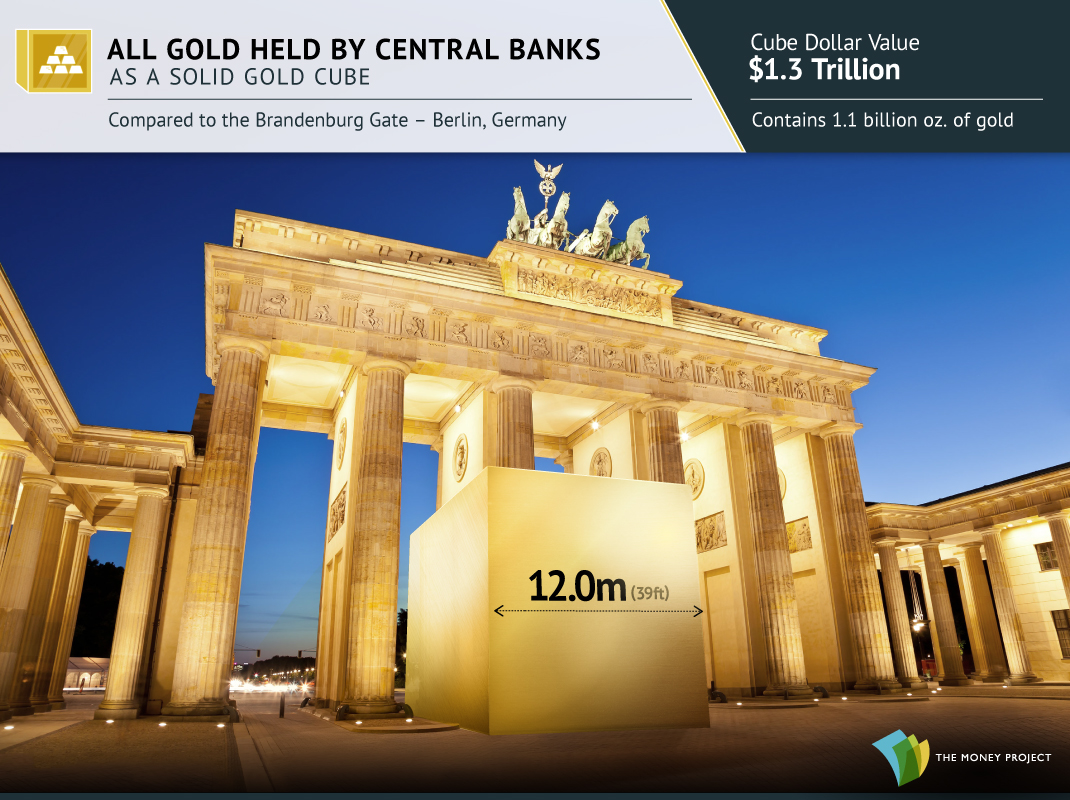
9. All gold held by the Central Banks pales in comparison to the Brandenburg Gate.
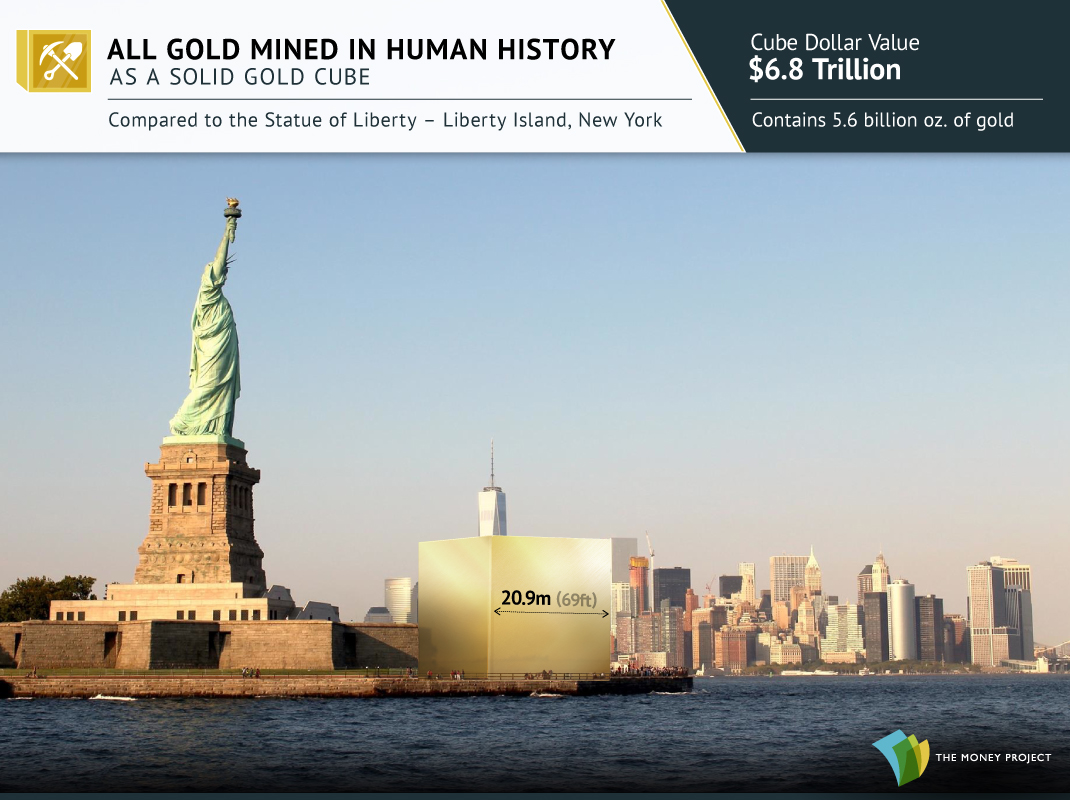
10. All gold mined in human history is dwarfed by the Statue of Liberty.
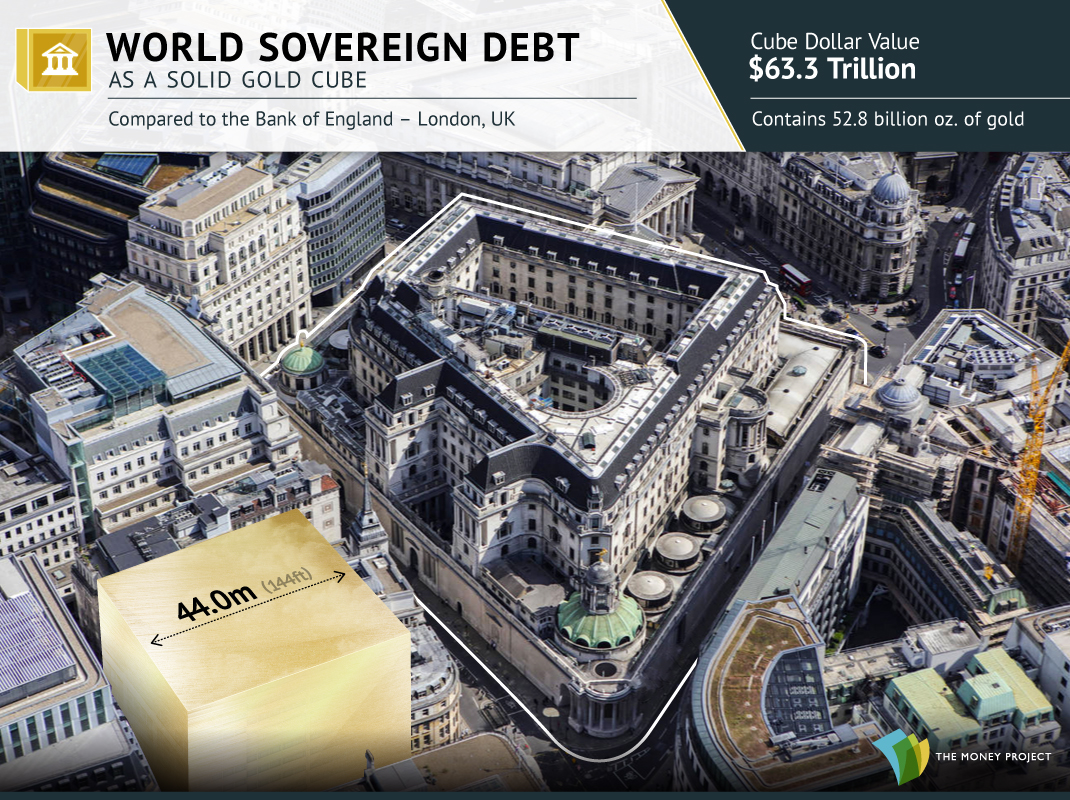
11. To pay off $63 trillion of global sovereign debt, you’d need a gold cube the size of a building.
Liked our visualizations of gold cubes? Check out this motion graphic video that shows how much money has been created by humans.
The Money Project is an ongoing collaboration between Visual Capitalist and Texas Precious Metals that seeks to use intuitive visualizations to explore the origins, nature, and use of money.


Mining
Visualizing the Copper Investment Opportunity in One Chart
This infographic from Sprott shows how early investors may benefit from the rapidly increasing demand for copper.
Visualizing the Copper Investment Opportunity in One Chart
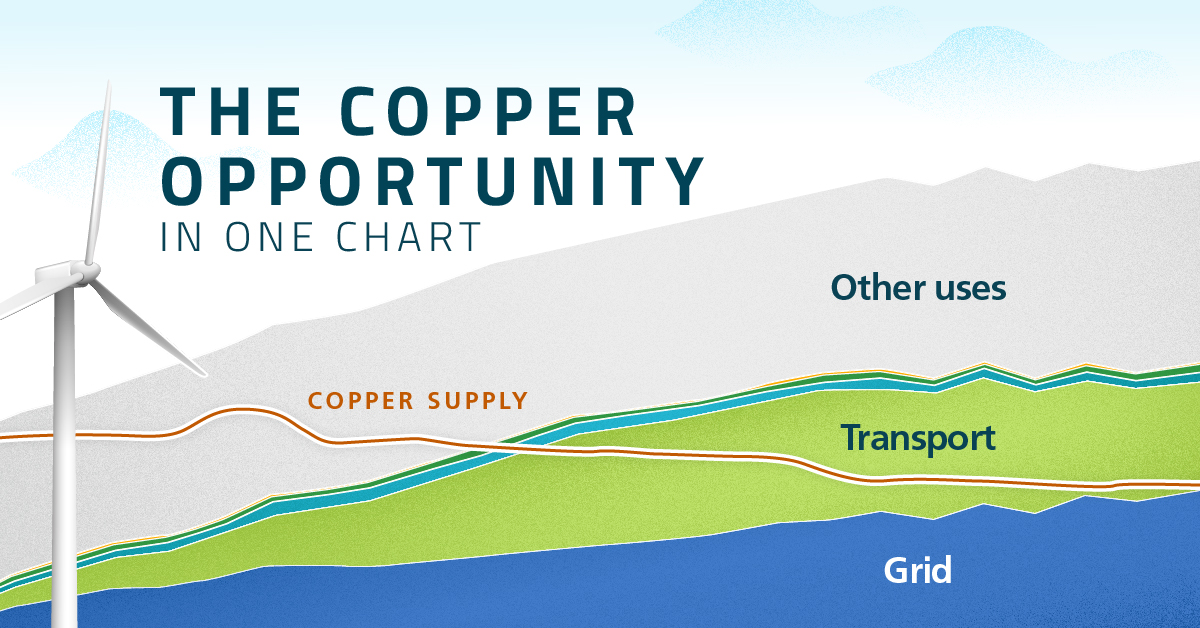
Copper is essential for clean energy applications such as solar panels, wind turbines, and electric vehicles (EVs), as well as for expanding electrical grids.
The surge in demand for the metal, driven by the growing adoption of these technologies, presents a unique investment opportunity for early investors in copper mining companies.
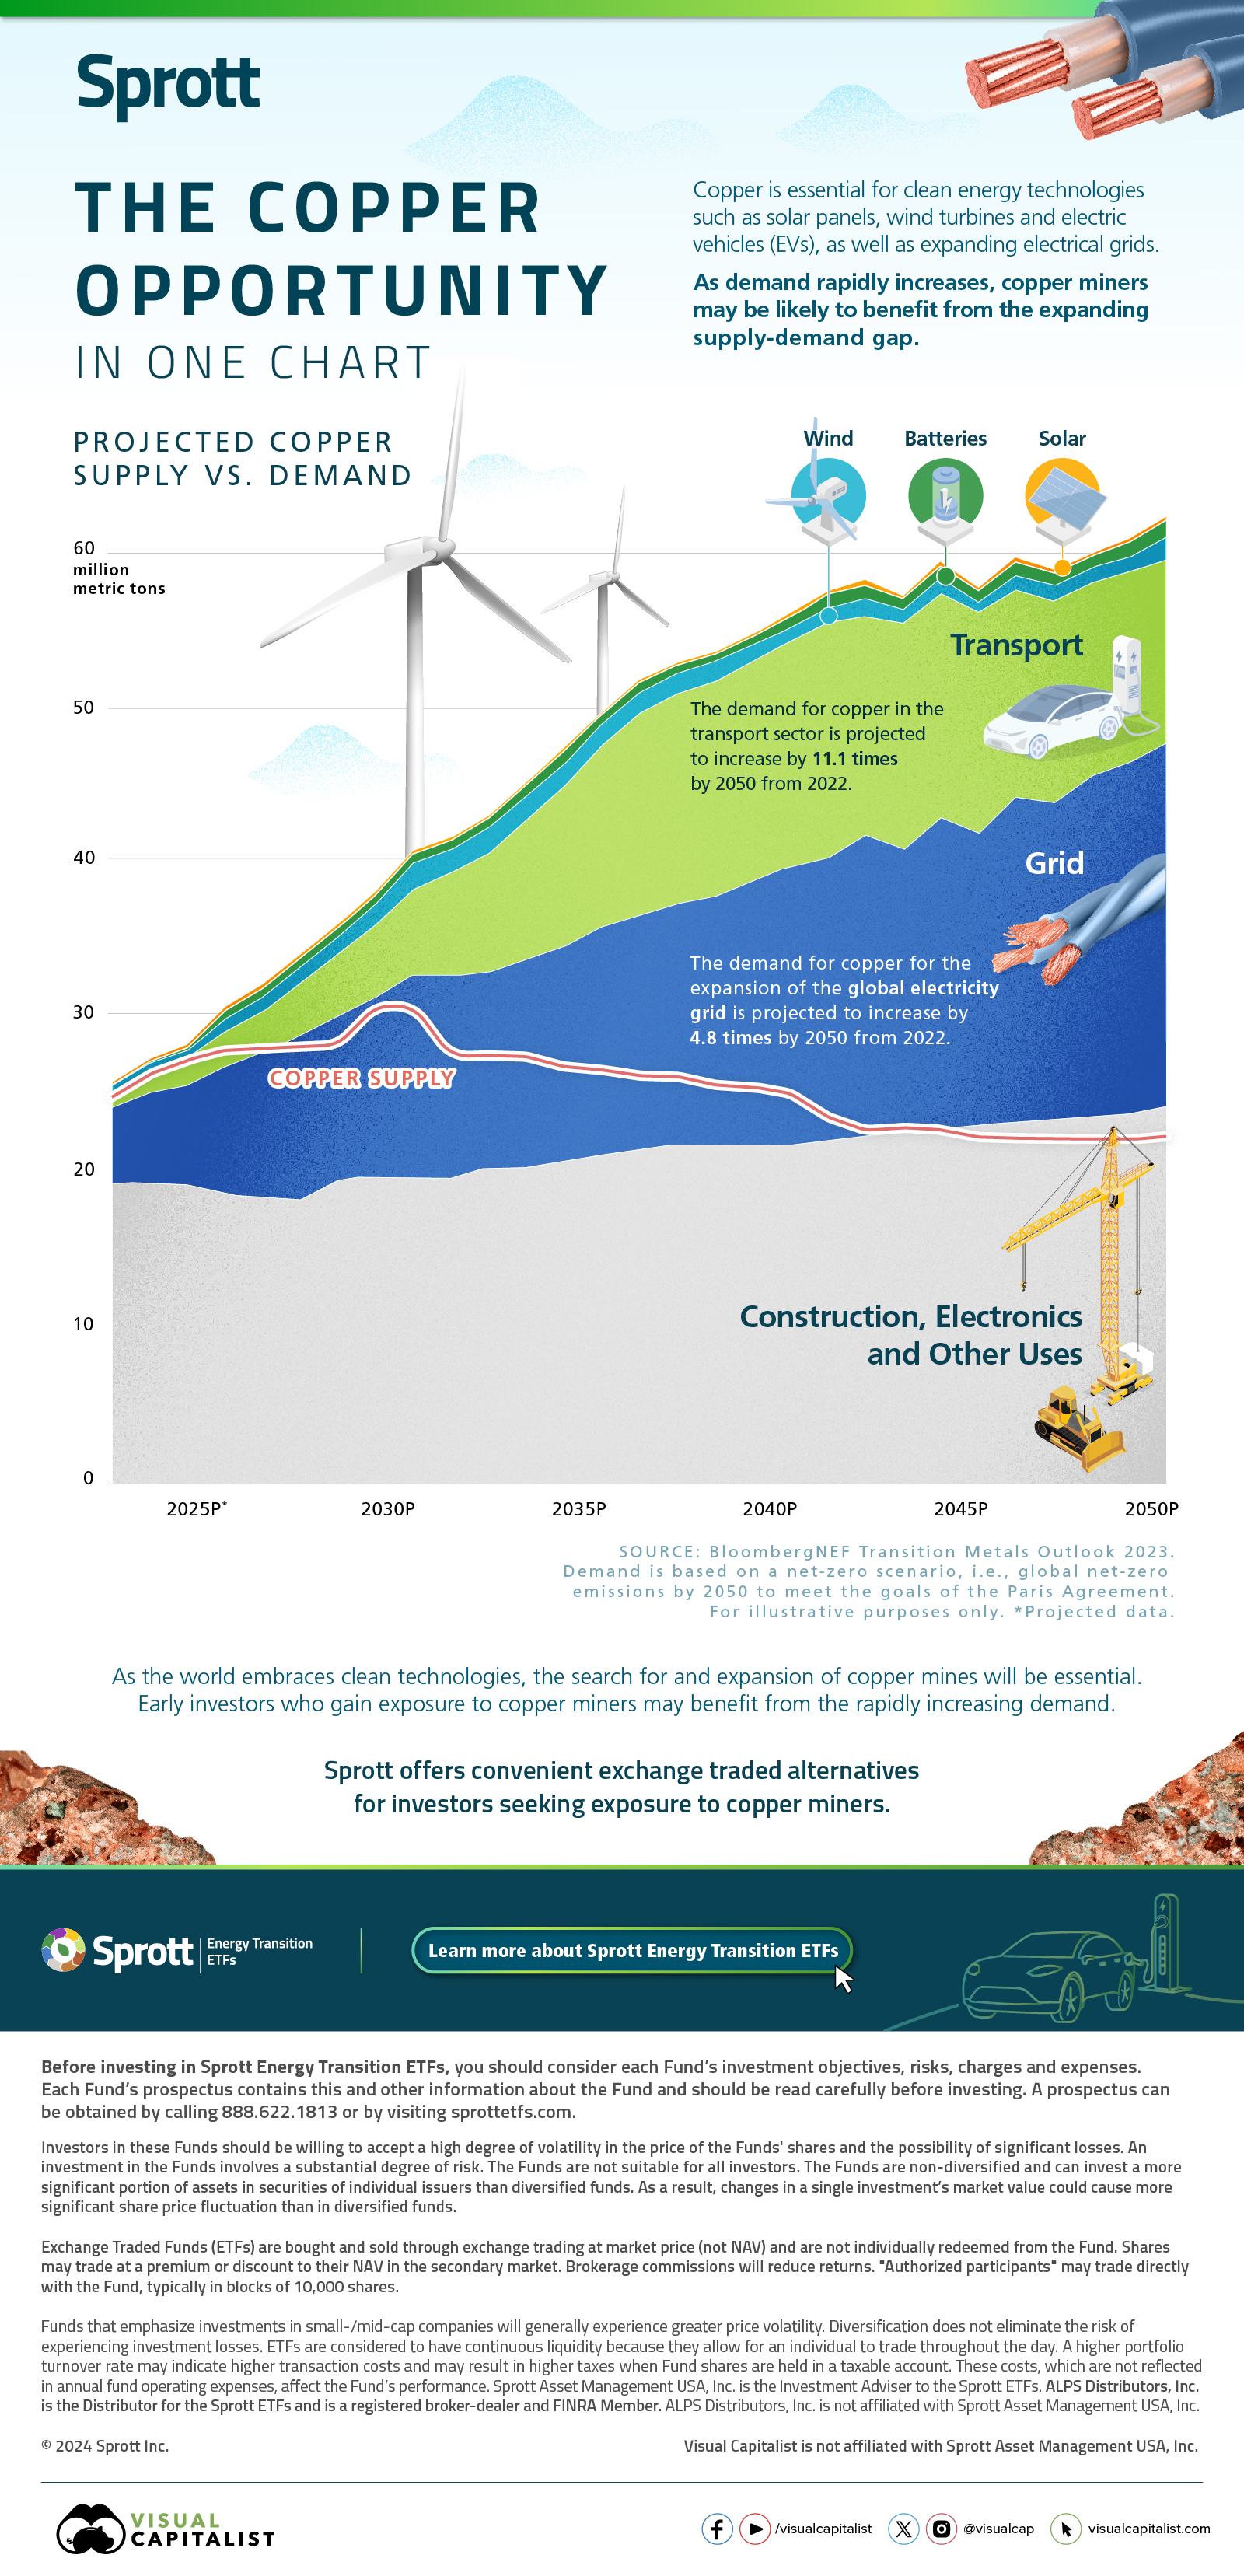
This chart by Sprott explores the growing gap between copper supply and demand until 2050, based on projections from BloombergNEF’s Transition Metals Outlook 2023.
Projected Copper Supply vs. Demand
Copper is naturally abundant on Earth, but extracting the metal at the pace necessary for an electrified economy could be a challenge. The timeline for bringing a copper mine from discovery to production is lengthy, averaging over 16 years.
Top producers like Chile and Peru are facing strikes and protests, along with declining ore grades. Russia, ranked seventh in copper production, faces an expected decline in production due to the ongoing war in Ukraine.
Meanwhile, the increasing adoption of carbon-free technology only highlights copper’s significance.
High Demand for Transport and Electricity Grid
The demand for copper in the transport sector is projected to increase by 11.1 times by 2050, from 2022. EVs, for example, can contain more than a mile of copper wiring.
Additionally, the demand for copper needed to expand the global electricity grid is projected to increase by 4.8 times by 2050, from 2022.
By 2030, the copper supply gap is projected to approach 10 million metric tons, with both copper prices and copper mining stocks potentially set to benefit.
As the world embraces clean technologies, the search for and expansion of copper mines will be essential. Early investors who gain exposure to copper miners may benefit from the rapidly increasing demand.
Sprott offers convenient exchange-traded alternatives for investors seeking exposure to copper miners.
Learn more about Sprott Energy Transition ETFs.

-

 Mining20 hours ago
Where the World’s Aluminum is Smelted, by Country
This infographic shows estimated aluminum smelter production by country in 2023, based on data from the USGS.
-

 Mining1 week ago
Visualizing Global Gold Production in 2023
Gold production in 2023 was led by China, Australia, and Russia, with each outputting over 300 tonnes.
-

 Energy2 weeks ago
Ranked: The Top 10 EV Battery Manufacturers in 2023
Asia dominates this ranking of the world’s largest EV battery manufacturers in 2023.
-

 Mining3 weeks ago
Gold vs. S&P 500: Which Has Grown More Over Five Years?
The price of gold has set record highs in 2024, but how has this precious metal performed relative to the S&P 500?
-

 Mining1 month ago
Charted: The Value Gap Between the Gold Price and Gold Miners
While the price of gold has reached new record highs in 2024, gold mining stocks are still far from their 2011 peaks.
-

 Energy3 months ago
Charted: Global Uranium Reserves, by Country
We visualize the distribution of the world’s uranium reserves by country, with 3 countries accounting for more than half of total reserves.

-

 Markets5 days ago
Visualizing Global Inflation Forecasts (2024-2026)
-

 Green2 weeks ago
The Carbon Footprint of Major Travel Methods
-

 United States2 weeks ago
Visualizing the Most Common Pets in the U.S.
-

 Culture2 weeks ago
The World’s Top Media Franchises by All-Time Revenue
-

 voronoi1 week ago
Best Visualizations of April on the Voronoi App
-

 Wealth1 week ago
Charted: Which Country Has the Most Billionaires in 2024?
-

 Business1 week ago
The Top Private Equity Firms by Country
-

 Markets1 week ago
The Best U.S. Companies to Work for According to LinkedIn