

This graphic showcases electricity emissions by state, highlighting each state's largest source of power.
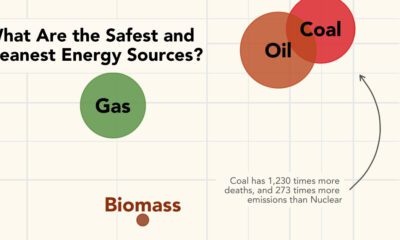

What are the safest energy sources? This graphic shows both GHG emissions and accidental deaths caused by different energy sources.
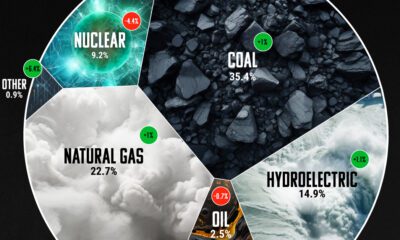

Coal still leads the charge when it comes to electricity, representing 35% of global power generation.


As Europe and the EU shift away from fossil fuels, which energy sources are European countries depending on for their electricity generation?
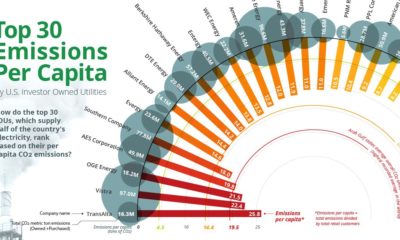

Roughly 25% of all GHG emissions come from electricity production. See how the top 30 IOUs rank by emissions per capita.
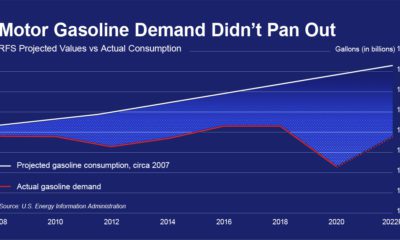

Biofuel mandates were passed in 2005, this graphic shows why they've become out of touch with modern transportation and are costing billions.
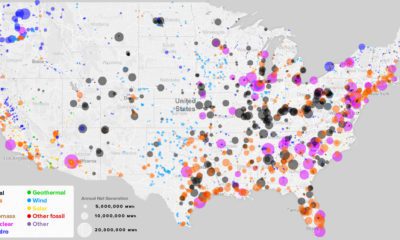

What sources of power are closest to you, and how has this mix changed over the last 10 years? See every power plant in the U.S....
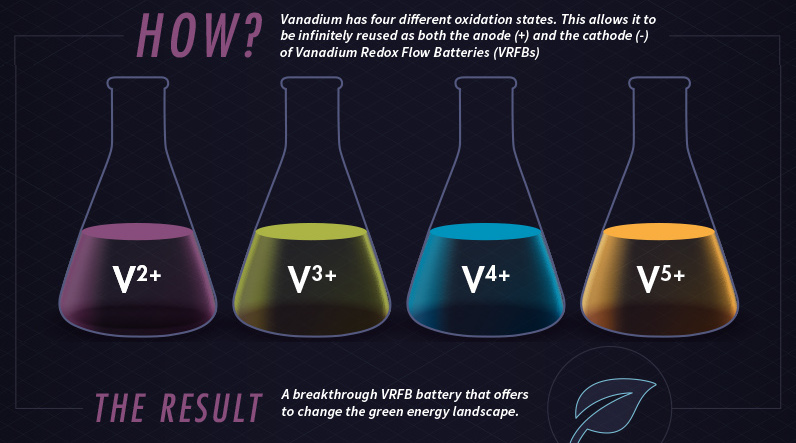
Using vanadium's 4 different oxidation states, vanadium redox flow batteries (VRFBs) could be a crucial step forward for energy storage in the green revolution.
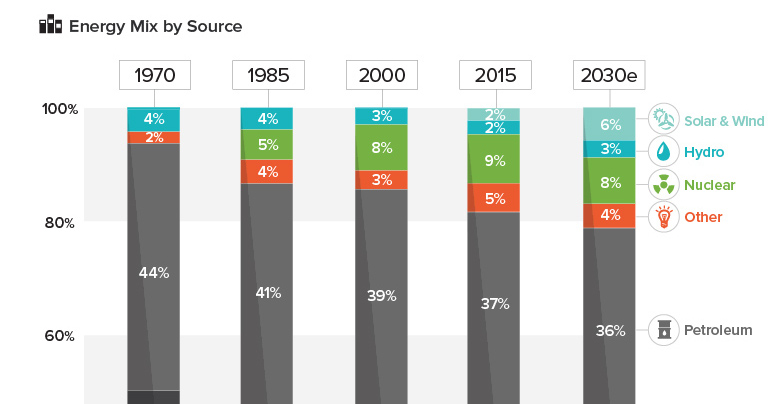
See how America's energy mix has evolved from 1970 until today, as well as a projection for the energy sources to be used in the year...
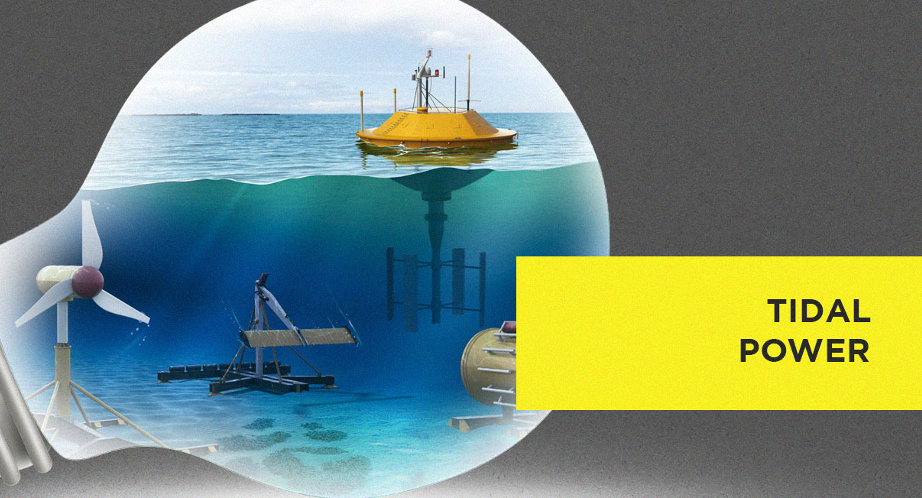
Which new sources of energy have promise? This infographic highlights the upcoming technologies that may provide the alternative energy sources of the future.


 Creator Program