Markets
Intangible Assets: A Hidden but Crucial Driver of Company Value
View the full-size version of this infographic.

Intangible Assets Take Center Stage
View the high resolution version of this infographic by clicking here
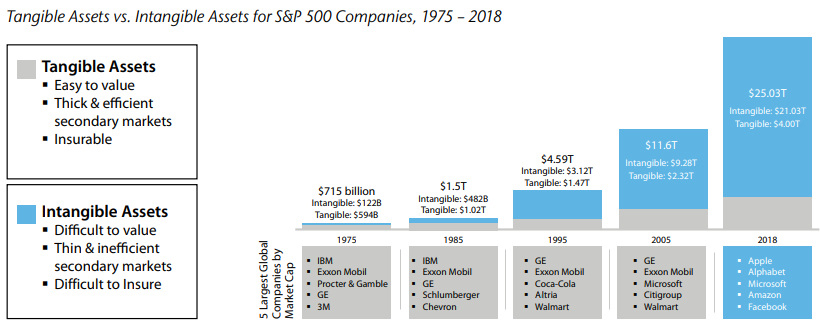
In 2018, intangible assets for S&P 500 companies hit a record value of $21 trillion. These assets, which are not physical in nature and include things like intellectual property, have rapidly risen in importance compared to tangible assets like cash.
Today’s infographic from Raconteur highlights the growth of intangible asset valuations, and how senior decision-makers view intangibles when making investment decisions.
Tracking the Growth of Intangibles
Intangibles used to play a much smaller role than they do now, with physical assets comprising the majority of value for most enterprise companies. However, an increasingly competitive and digital economy has placed the focus on things like intellectual property, as companies race to out-innovate one another.
To measure this historical shift, Aon and the Ponemon Institute analyzed the value of intangible and tangible assets over nearly four and a half decades on the S&P 500. Here’s how they stack up:
Source: Aon
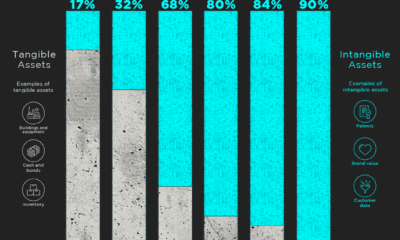
In just 43 years, intangibles have evolved from a supporting asset into a major consideration for investors – today, they make up 84% of all enterprise value on the S&P 500, a massive increase from just 17% in 1975.
The Largest Companies by Intangible Value
Digital-centric sectors, such as internet & software and technology & IT, are heavily reliant on intangible assets.
Brand Finance, which produces an annual ranking of companies based on intangible value, has companies in these sectors taking the top five spots on the 2019 edition of their report.
| Rank | Company | Sector | Total Intangible Value | Share of Enterprise Value |
|---|---|---|---|---|
| 1 | Microsoft | Internet & Software | $904B | 90% |
| 2 | Amazon | Internet & Software | $839B | 93% |
| 3 | Apple | Technology & IT | $675B | 77% |
| 4 | Alphabet | Internet & Software | $521B | 65% |
| 5 | Internet & Software | $409B | 79% | |
| 6 | AT&T | Telecoms | $371B | 84% |
| 7 | Tencent | Internet & Software | $365B | 88% |
| 8 | Johnson & Johnson | Pharma | $361B | 101% |
| 9 | Visa | Banking | $348B | 100% |
| 10 | Alibaba | Internet & Software | $344B | 86% |
| 11 | Nestle | Food | $313B | 89% |
| 12 | Procter & Gamble | Cosmetics & Personal Care | $305B | 101% |
| 13 | Anheuser-Busch InBev | Beers | $304B | 99% |
| 14 | Verizon | Telecoms | $300B | 83% |
| 15 | Comcast | Media | $276B | 92% |
| 16 | Mastercard | Banking | $259B | 99% |
| 17 | Novartis | Pharma | $252B | 101% |
| 18 | Walmart | Retail | $252B | 68% |
| 19 | Unitedhealth | Healthcare | $245B | 94% |
| 20 | Pfizer | Pharma | $235B | 98% |
Note: Percentages may exceed 100% due to rounding.
Microsoft overtook Amazon for the top spot in the ranking for 2019, with $904B in intangible assets. The company has the largest commercial cloud business in the world.
Pharma and healthcare companies are also prominent on the list, comprising four of the top 20. Their intangible value is largely driven by patents, as well as mergers and acquisitions. Johnson & Johnson, for example, reported $32B in patents and trademarks in their latest annual report.
A Lack of Disclosure
It’s important to note that Brand Finance’s ranking is based on both disclosed intangibles—those that are reported on a company’s balance sheet—and undisclosed intangibles. In the ranking, undisclosed intangibles were calculated as the difference between a company’s market value and book value.
The majority of intangibles are not reported on balance sheets because accounting standards do not recognize them until a transaction has occurred to support their value. While many accounting managers see this as a prudent measure to stop unsubstantiated asset values, it means that many highly valuable intangibles never appear in financial reporting. In fact, 34% of the total worth of the world’s publicly traded companies is made up of undisclosed value.
“It is time for CEOs, CFOs, and CMOs to start a long overdue reporting revolution.”
—David Haigh, CEO of Brand Finance
Brand Finance believes that companies should regularly value each intangible asset, including the key assumptions management made when deriving their value. This information would be extremely useful for managers, investors, and other stakeholders.
A Key Consideration
Investment professionals certainly agree on the importance of intangibles. In a survey of institutional investors by Columbia Threadneedle, it was found that 95% agreed that intangible assets contain crucial information about the future strength of a company’s business model.
Moreover, 98% agree that more transparency would be beneficial to their assessment of intangible assets. In the absence of robust reporting, Columbia Threadneedle believes active managers are well equipped to understand intangible asset values due to their access to management, relationships with key opinion leaders, and deep industry expertise.
By undertaking rigorous analysis, managers may uncover hidden competitive advantages—and generate higher potential returns in the process.


Markets
The European Stock Market: Attractive Valuations Offer Opportunities
On average, the European stock market has valuations that are nearly 50% lower than U.S. valuations. But how can you access the market?


European Stock Market: Attractive Valuations Offer Opportunities
Europe is known for some established brands, from L’Oréal to Louis Vuitton. However, the European stock market offers additional opportunities that may be lesser known.
The above infographic, sponsored by STOXX, outlines why investors may want to consider European stocks.
Attractive Valuations
Compared to most North American and Asian markets, European stocks offer lower or comparable valuations.
| Index | Price-to-Earnings Ratio | Price-to-Book Ratio |
|---|---|---|
| EURO STOXX 50 | 14.9 | 2.2 |
| STOXX Europe 600 | 14.4 | 2 |
| U.S. | 25.9 | 4.7 |
| Canada | 16.1 | 1.8 |
| Japan | 15.4 | 1.6 |
| Asia Pacific ex. China | 17.1 | 1.8 |
Data as of February 29, 2024. See graphic for full index names. Ratios based on trailing 12 month financials. The price to earnings ratio excludes companies with negative earnings.
On average, European valuations are nearly 50% lower than U.S. valuations, potentially offering an affordable entry point for investors.
Research also shows that lower price ratios have historically led to higher long-term returns.
Market Movements Not Closely Connected
Over the last decade, the European stock market had low-to-moderate correlation with North American and Asian equities.
The below chart shows correlations from February 2014 to February 2024. A value closer to zero indicates low correlation, while a value of one would indicate that two regions are moving in perfect unison.
| EURO STOXX 50 | STOXX EUROPE 600 | U.S. | Canada | Japan | Asia Pacific ex. China |
|
|---|---|---|---|---|---|---|
| EURO STOXX 50 | 1.00 | 0.97 | 0.55 | 0.67 | 0.24 | 0.43 |
| STOXX EUROPE 600 | 1.00 | 0.56 | 0.71 | 0.28 | 0.48 | |
| U.S. | 1.00 | 0.73 | 0.12 | 0.25 | ||
| Canada | 1.00 | 0.22 | 0.40 | |||
| Japan | 1.00 | 0.88 | ||||
| Asia Pacific ex. China | 1.00 |
Data is based on daily USD returns.
European equities had relatively independent market movements from North American and Asian markets. One contributing factor could be the differing sector weights in each market. For instance, technology makes up a quarter of the U.S. market, but health care and industrials dominate the broader European market.
Ultimately, European equities can enhance portfolio diversification and have the potential to mitigate risk for investors.
Tracking the Market
For investors interested in European equities, STOXX offers a variety of flagship indices:
| Index | Description | Market Cap |
|---|---|---|
| STOXX Europe 600 | Pan-regional, broad market | €10.5T |
| STOXX Developed Europe | Pan-regional, broad-market | €9.9T |
| STOXX Europe 600 ESG-X | Pan-regional, broad market, sustainability focus | €9.7T |
| STOXX Europe 50 | Pan-regional, blue-chip | €5.1T |
| EURO STOXX 50 | Eurozone, blue-chip | €3.5T |
Data is as of February 29, 2024. Market cap is free float, which represents the shares that are readily available for public trading on stock exchanges.
The EURO STOXX 50 tracks the Eurozone’s biggest and most traded companies. It also underlies one of the world’s largest ranges of ETFs and mutual funds. As of November 2023, there were €27.3 billion in ETFs and €23.5B in mutual fund assets under management tracking the index.
“For the past 25 years, the EURO STOXX 50 has served as an accurate, reliable and tradable representation of the Eurozone equity market.”
— Axel Lomholt, General Manager at STOXX
Partnering with STOXX to Track the European Stock Market
Are you interested in European equities? STOXX can be a valuable partner:
- Comprehensive, liquid and investable ecosystem
- European heritage, global reach
- Highly sophisticated customization capabilities
- Open architecture approach to using data
- Close partnerships with clients
- Part of ISS STOXX and Deutsche Börse Group
With a full suite of indices, STOXX can help you benchmark against the European stock market.
Learn how STOXX’s European indices offer liquid and effective market access.

-

 Economy1 day ago
Economic Growth Forecasts for G7 and BRICS Countries in 2024
The IMF has released its economic growth forecasts for 2024. How do the G7 and BRICS countries compare?
-

 Markets1 week ago
U.S. Debt Interest Payments Reach $1 Trillion
U.S. debt interest payments have surged past the $1 trillion dollar mark, amid high interest rates and an ever-expanding debt burden.
-

 United States2 weeks ago
Ranked: The Largest U.S. Corporations by Number of Employees
We visualized the top U.S. companies by employees, revealing the massive scale of retailers like Walmart, Target, and Home Depot.
-

 Markets2 weeks ago
The Top 10 States by Real GDP Growth in 2023
This graphic shows the states with the highest real GDP growth rate in 2023, largely propelled by the oil and gas boom.
-

 Markets2 weeks ago
Ranked: The World’s Top Flight Routes, by Revenue
In this graphic, we show the highest earning flight routes globally as air travel continued to rebound in 2023.
-

 Markets2 weeks ago
Ranked: The Most Valuable Housing Markets in America
The U.S. residential real estate market is worth a staggering $47.5 trillion. Here are the most valuable housing markets in the country.

-

 Mining1 week ago
Gold vs. S&P 500: Which Has Grown More Over Five Years?
-
Markets2 weeks ago
Ranked: The Most Valuable Housing Markets in America
-

 Money2 weeks ago
Which States Have the Highest Minimum Wage in America?
-

 AI2 weeks ago
Ranked: Semiconductor Companies by Industry Revenue Share
-
Markets2 weeks ago
Ranked: The World’s Top Flight Routes, by Revenue
-

 Demographics2 weeks ago
Population Projections: The World’s 6 Largest Countries in 2075
-
Markets2 weeks ago
The Top 10 States by Real GDP Growth in 2023
-

 Demographics2 weeks ago
The Smallest Gender Wage Gaps in OECD Countries