Markets
Germany’s Demographic Cliff [Chart]
![Germany's Demographic Cliff [Chart]](https://www.visualcapitalist.com/wp-content/uploads/2016/02/germany-demographic-cliff-chart.png)
Germany’s Demographic Cliff [Chart]
Why Europe’s largest economy could be destined to be the next Japan
The Chart of the Week is a weekly Visual Capitalist feature on Fridays.
Last week’s chart showed that the world is turning Japanese with tales of economic malaise, extreme monetary policy, and negative rates. Germany, with its 5-yr government bond currently trading at a -0.33% yield, is no exception to this story.
However, negative yields are not the only concern that the country has in common with Japan. It’s the overall demographic picture that is worrying, and it could have a big effect on Germany’s economic future as well as the tough choices that must be made today.
Germany’s Importance
Germany is the most populous and productive economy in Europe, with 80 million people and a GDP of almost $4 trillion. It’s also the world’s third largest exporter, and that’s why it had the largest trade surplus globally in 2014 with $285 billion.
For all of its economic power, Germany has a key weakness that could potentially be its Achilles heel: it’s projected that Germany’s population will decline significantly over the coming decades, and the ratio of workers to dependents will become one of the worst in the world.
The Math
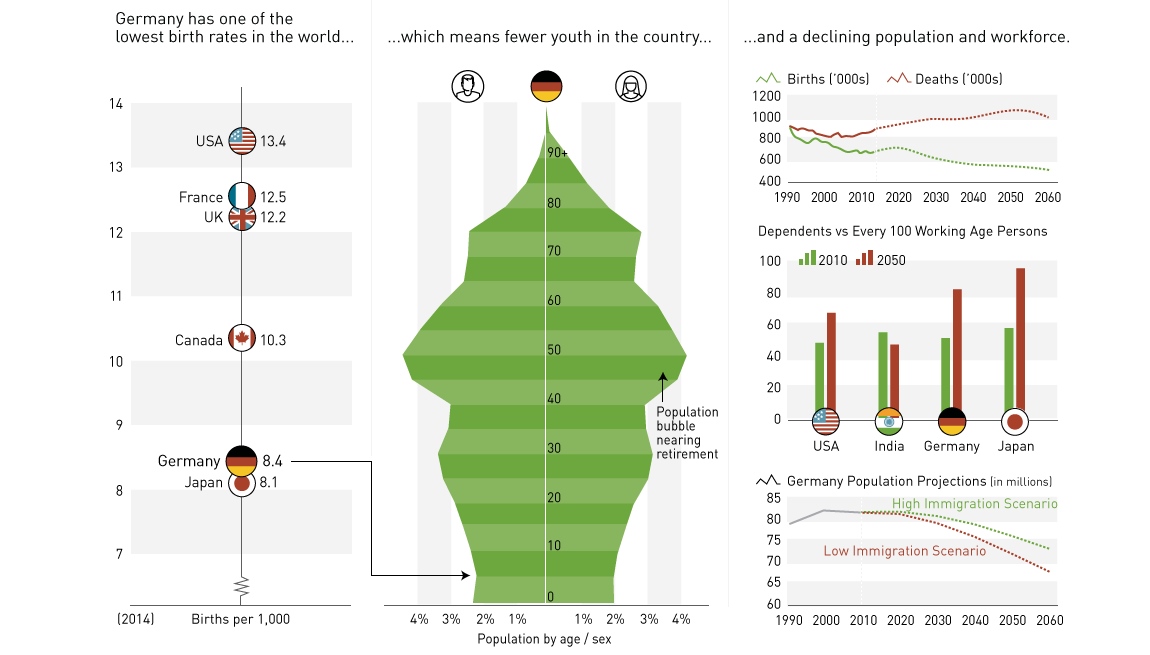
Every year, there are 8.4 births and 11.3 deaths per 1,000 people in Germany. The way this plays out over time is that the percentage of Germans under 15 will fall to 13% of the population by 2050, while the amount of people over 60 years old is to rise to 39%.
In the future, it is likely that there will not be enough youth or workers in the country. As Baby Boomers retire, there will be a larger burden placed on those paying into the government’s social safety net and other programs. Further, this widening gap will also mean a significant loss of experience, skill, and know-how in the workforce that will create coinciding economic challenges for the population.
In many Western nations, immigration plays a key role in keeping a population with low birth rates to be sustainable. However, in Germany’s case, both the high and low immigration scenarios look dire for future numbers. Germany’s state statistical authority currently projects a “high immigration” trend resulting in a drop to 73.1 million people by 2060, while a low-end estimate sees the population falling all the way to 67.6 million.
Choices
The U.N. projects that one in every six Germans will be over 80 years old by 2050. Are Germans comfortable with their nation remaining on this path?
If yes, then they must also be comfortable with a significant decrease in Germany’s economic role in the future. The country will almost certainly be on a more level stage with the U.K. and France, and it will have a diminished place on the world stage as Asia and Africa continue their rise. Tax rates will surge as a decreasing amount of workers pay into the system, and economic growth could stall in such a way that Germany has its own “Lost Decade”.
If no, then Germans must accept that there is only one realistic way to combat this trend: to open the immigration floodgates even more. While this is not what many Germans want to hear, especially as the current migrant and refugee crisis progresses, it is an option that must be weighed with careful consideration.
Either way, there are difficult choices to be made. How Germany proceeds with this question has implications both today and tomorrow on cultural, economic, and political levels.


Markets
Mapped: Europe’s GDP Per Capita, by Country
Which European economies are richest on a GDP per capita basis? This map shows the results for 44 countries across the continent.


Mapped: Europe’s GDP Per Capita, by Country (2024)
This was originally posted on our Voronoi app. Download the app for free on iOS or Android and discover incredible data-driven charts from a variety of trusted sources.
Europe is home to some of the largest and most sophisticated economies in the world. But how do countries in the region compare with each other on a per capita productivity basis?
In this map, we show Europe’s GDP per capita levels across 44 nations in current U.S. dollars. Data for this visualization and article is sourced from the International Monetary Fund (IMF) via their DataMapper tool, updated April 2024.
Europe’s Richest and Poorest Nations, By GDP Per Capita
Luxembourg, Ireland, and Switzerland, lead the list of Europe’s richest nations by GDP per capita, all above $100,000.
| Rank | Country | GDP Per Capita (2024) |
|---|---|---|
| 1 | 🇱🇺 Luxembourg | $131,380 |
| 2 | 🇮🇪 Ireland | $106,060 |
| 3 | 🇨🇭 Switzerland | $105,670 |
| 4 | 🇳🇴 Norway | $94,660 |
| 5 | 🇮🇸 Iceland | $84,590 |
| 6 | 🇩🇰 Denmark | $68,900 |
| 7 | 🇳🇱 Netherlands | $63,750 |
| 8 | 🇸🇲 San Marino | $59,410 |
| 9 | 🇦🇹 Austria | $59,230 |
| 10 | 🇸🇪 Sweden | $58,530 |
| 11 | 🇧🇪 Belgium | $55,540 |
| 12 | 🇫🇮 Finland | $55,130 |
| 13 | 🇩🇪 Germany | $54,290 |
| 14 | 🇬🇧 UK | $51,070 |
| 15 | 🇫🇷 France | $47,360 |
| 16 | 🇦🇩 Andorra | $44,900 |
| 17 | 🇲🇹 Malta | $41,740 |
| 18 | 🇮🇹 Italy | $39,580 |
| 19 | 🇨🇾 Cyprus | $37,150 |
| 20 | 🇪🇸 Spain | $34,050 |
| 21 | 🇸🇮 Slovenia | $34,030 |
| 22 | 🇪🇪 Estonia | $31,850 |
| 23 | 🇨🇿 Czech Republic | $29,800 |
| 24 | 🇵🇹 Portugal | $28,970 |
| 25 | 🇱🇹 Lithuania | $28,410 |
| 26 | 🇸🇰 Slovakia | $25,930 |
| 27 | 🇱🇻 Latvia | $24,190 |
| 28 | 🇬🇷 Greece | $23,970 |
| 29 | 🇭🇺 Hungary | $23,320 |
| 30 | 🇵🇱 Poland | $23,010 |
| 31 | 🇭🇷 Croatia | $22,970 |
| 32 | 🇷🇴 Romania | $19,530 |
| 33 | 🇧🇬 Bulgaria | $16,940 |
| 34 | 🇷🇺 Russia | $14,390 |
| 35 | 🇹🇷 Türkiye | $12,760 |
| 36 | 🇲🇪 Montenegro | $12,650 |
| 37 | 🇷🇸 Serbia | $12,380 |
| 38 | 🇦🇱 Albania | $8,920 |
| 39 | 🇧🇦 Bosnia & Herzegovina | $8,420 |
| 40 | 🇲🇰 North Macedonia | $7,690 |
| 41 | 🇧🇾 Belarus | $7,560 |
| 42 | 🇲🇩 Moldova | $7,490 |
| 43 | 🇽🇰 Kosovo | $6,390 |
| 44 | 🇺🇦 Ukraine | $5,660 |
| N/A | 🇪🇺 EU Average | $44,200 |
Note: Figures are rounded.
Three Nordic countries (Norway, Iceland, Denmark) also place highly, between $70,000-90,000. Other Nordic peers, Sweden and Finland rank just outside the top 10, between $55,000-60,000.
Meanwhile, Europe’s biggest economies in absolute terms, Germany, UK, and France, rank closer to the middle of the top 20, with GDP per capitas around $50,000.
Finally, at the end of the scale, Eastern Europe as a whole tends to have much lower per capita GDPs. In that group, Ukraine ranks last, at $5,660.
A Closer Look at Ukraine
For a broader comparison, Ukraine’s per capita GDP is similar to Iran ($5,310), El Salvador ($5,540), and Guatemala ($5,680).
According to experts, Ukraine’s economy has historically underperformed to expectations. After the fall of the Berlin Wall, the economy contracted for five straight years. Its transition to a Western, liberalized economic structure was overshadowed by widespread corruption, a limited taxpool, and few revenue sources.
Politically, its transformation from authoritarian regime to civil democracy has proved difficult, especially when it comes to institution building.
Finally, after the 2022 invasion of the country, Ukraine’s GDP contracted by 30% in a single year—the largest loss since independence. Large scale emigration—to the tune of six million refugees—is also playing a role.
Despite these challenges, the country’s economic growth has somewhat stabilized while fighting continues.

-

 Markets6 days ago
The Most Valuable Companies in Major EU Economies
-

 Wealth2 weeks ago
Charted: Which City Has the Most Billionaires in 2024?
-

 Technology2 weeks ago
All of the Grants Given by the U.S. CHIPS Act
-

 Green2 weeks ago
The Carbon Footprint of Major Travel Methods
-

 United States1 week ago
Visualizing the Most Common Pets in the U.S.
-

 Culture1 week ago
The World’s Top Media Franchises by All-Time Revenue
-

 Best of1 week ago
Best Visualizations of April on the Voronoi App
-

 Wealth1 week ago
Charted: Which Country Has the Most Billionaires in 2024?