Energy
Which Companies Make The Most Revenue Per Employee?
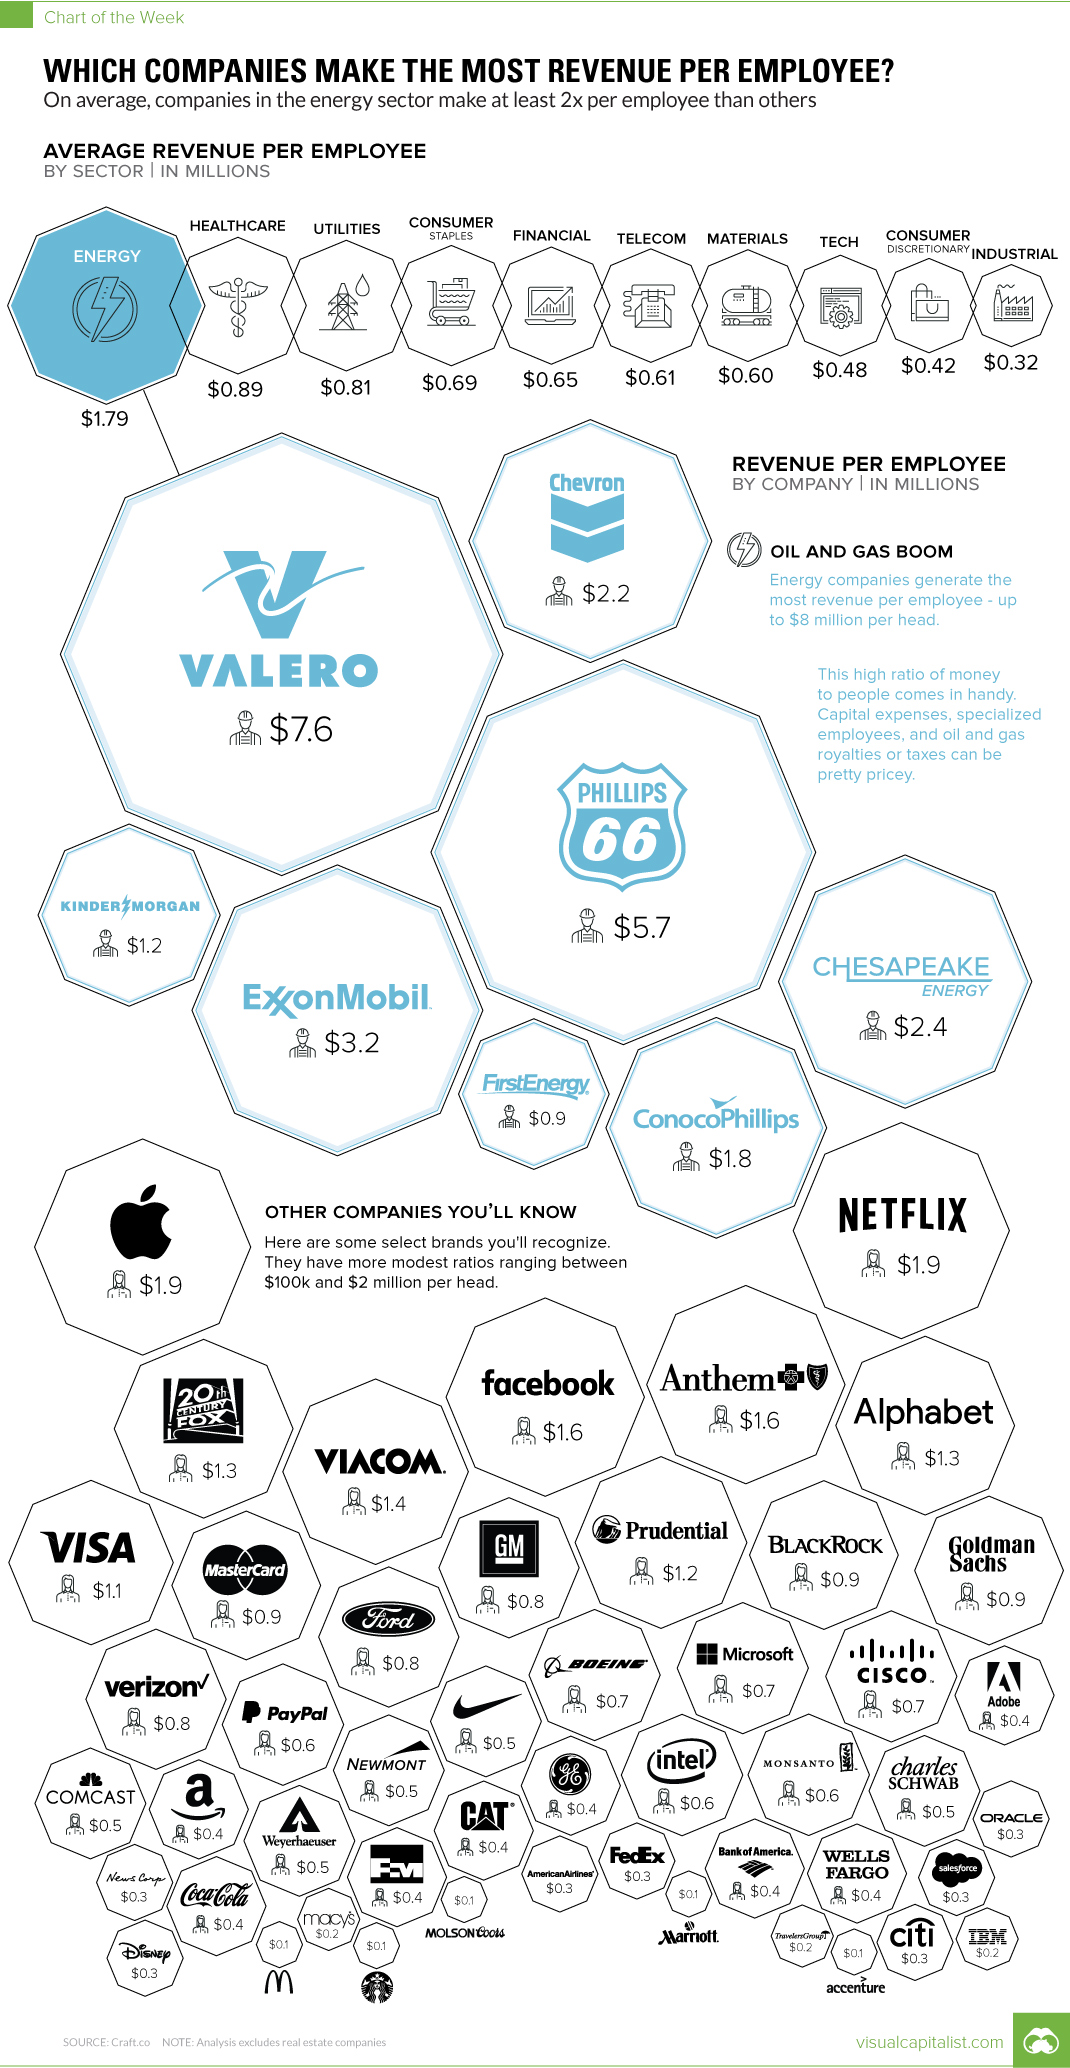
Which Companies Make The Most Revenue Per Employee?
On average, companies in the energy sector make at least 2x per employee than others
The Chart of the Week is a weekly Visual Capitalist feature on Fridays.
The world’s largest companies have many similarities, but the size of their respective org charts is not necessarily one of them.
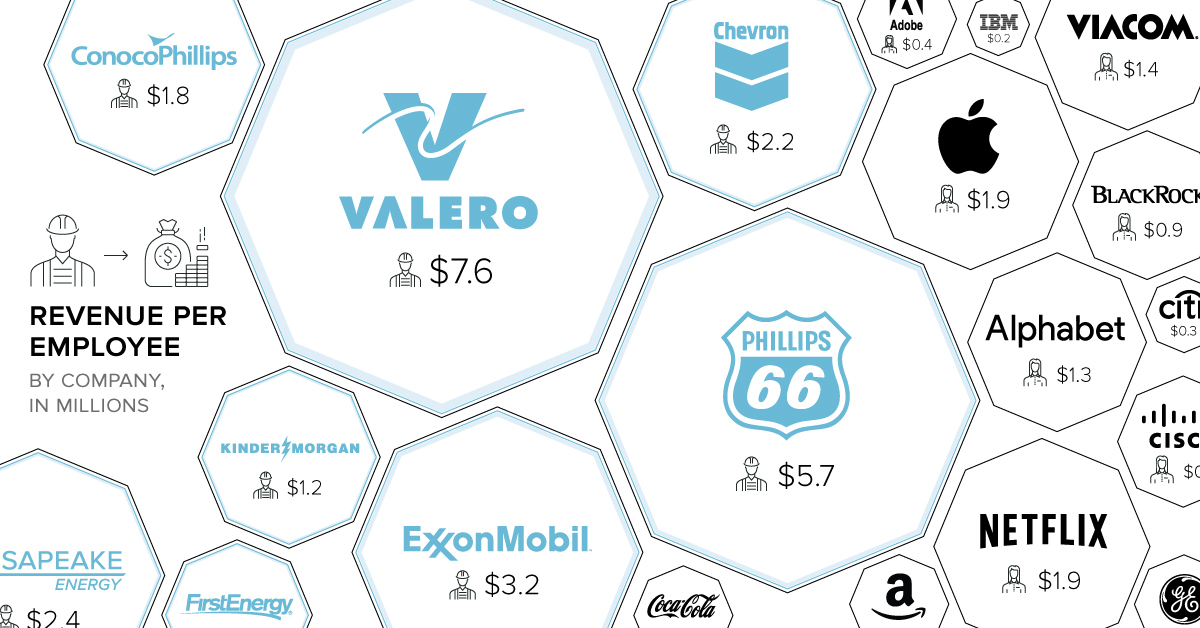
At the one extreme, companies such as Walmart require a massive workforce in the millions to run retail operations around the globe. But at the other extreme, an energy giant like Valero is able to generate $76 billion of annual revenue with just 0.4% of the employees of Walmart.
It raises the question: which types of companies make the most revenue per employee, and why?
Revenue Per Head
Today’s chart uses data on companies in the S&P 500 Index courtesy of analytics platform Craft.co.
Instead of plotting the information for all 500 companies, we focused on two groups of firms: (1) energy companies, which tended to skew towards the upper end of revenue per employee ratio, and (2) brands that you will be familiar with, like Netflix, Walmart, Goldman Sachs, Ford, or IBM.
The end result is an astonishing range, with companies making anywhere between <$100,000 per employee (Accenture, McDonald's, Starbucks, Marriott) all the way to >$7 million per employee (Valero Energy).
Industry Averages
Here’s a look at this same data expressed as averages at an industry level, based on the sub-sectors that make up the S&P 500:
| Rank | Sector | Avg. Revenue Per Employee |
|---|---|---|
| #1 | Energy | $1.79 million |
| #2 | Healthcare | $0.89 million |
| #3 | Utilities | $0.81 million |
| #4 | Consumer Staples | $0.70 million |
| #5 | Financials | $0.65 million |
| #6 | Telecommunications | $0.61 million |
| #7 | Materials | $0.60 million |
| #8 | Tech | $0.48 million |
| #9 | Consumer Discretionary | $0.42 million |
| #10 | Industrials | $0.32 million |
Note: this analysis excludes real estate companies
Interestingly, there is even a wide variance between sectors. Oil and gas companies make at least twice as much revenue per employee than the companies in all other sectors, while healthcare and utilities companies also have high ratios as well.
There is a plausible explanation for this large discrepancy, and it has to do with the cost of doing business.
Oil and gas companies have to spend billions of dollars on capital expenditures to build and maintain plants and rigs, while paying extra taxes and royalties. Healthcare companies have to spend a lot on R&D to stay competitive, while utilities must maintain vast amounts of infrastructure. At the same time, all of these sectors generally hire very specialized employees like engineers or scientists, which cost more than average.


Who’s Building the Most Solar Energy?
This was originally posted on our Voronoi app. Download the app for free on iOS or Android and discover incredible data-driven charts from a variety of trusted sources.
In 2023, solar energy accounted for three-quarters of renewable capacity additions worldwide. Most of this growth occurred in Asia, the EU, and the U.S., continuing a trend observed over the past decade.
In this graphic, we illustrate the rise in installed solar photovoltaic (PV) capacity in China, the EU, and the U.S. between 2010 and 2022, measured in gigawatts (GW). Bruegel compiled the data..
Chinese Dominance
As of 2022, China’s total installed capacity stands at 393 GW, nearly double that of the EU’s 205 GW and surpassing the USA’s total of 113 GW by more than threefold in absolute terms.
| Installed solar capacity (GW) | China | EU27 | U.S. |
|---|---|---|---|
| 2022 | 393.0 | 205.5 | 113.0 |
| 2021 | 307.0 | 162.7 | 95.4 |
| 2020 | 254.0 | 136.9 | 76.4 |
| 2019 | 205.0 | 120.1 | 61.6 |
| 2018 | 175.3 | 104.0 | 52.0 |
| 2017 | 130.8 | 96.2 | 43.8 |
| 2016 | 77.8 | 91.5 | 35.4 |
| 2015 | 43.6 | 87.7 | 24.2 |
| 2014 | 28.4 | 83.6 | 18.1 |
| 2013 | 17.8 | 79.7 | 13.3 |
| 2012 | 6.7 | 71.1 | 8.6 |
| 2011 | 3.1 | 53.3 | 5.6 |
| 2010 | 1.0 | 30.6 | 3.4 |
Since 2017, China has shown a compound annual growth rate (CAGR) of approximately 25% in installed PV capacity, while the USA has seen a CAGR of 21%, and the EU of 16%.
Additionally, China dominates the production of solar power components, currently controlling around 80% of the world’s solar panel supply chain.
In 2022, China’s solar industry employed 2.76 million individuals, with manufacturing roles representing approximately 1.8 million and the remaining 918,000 jobs in construction, installation, and operations and maintenance.
The EU industry employed 648,000 individuals, while the U.S. reached 264,000 jobs.
According to the IEA, China accounts for almost 60% of new renewable capacity expected to become operational globally by 2028.
Despite the phasing out of national subsidies in 2020 and 2021, deployment of solar PV in China is accelerating. The country is expected to reach its national 2030 target for wind and solar PV installations in 2024, six years ahead of schedule.

-

 Markets6 days ago
The Most Valuable Companies in Major EU Economies
-

 Wealth2 weeks ago
Charted: Which City Has the Most Billionaires in 2024?
-

 Technology2 weeks ago
All of the Grants Given by the U.S. CHIPS Act
-

 Green2 weeks ago
The Carbon Footprint of Major Travel Methods
-

 United States2 weeks ago
Visualizing the Most Common Pets in the U.S.
-

 Culture1 week ago
The World’s Top Media Franchises by All-Time Revenue
-

 voronoi1 week ago
Best Visualizations of April on the Voronoi App
-

 Wealth1 week ago
Charted: Which Country Has the Most Billionaires in 2024?