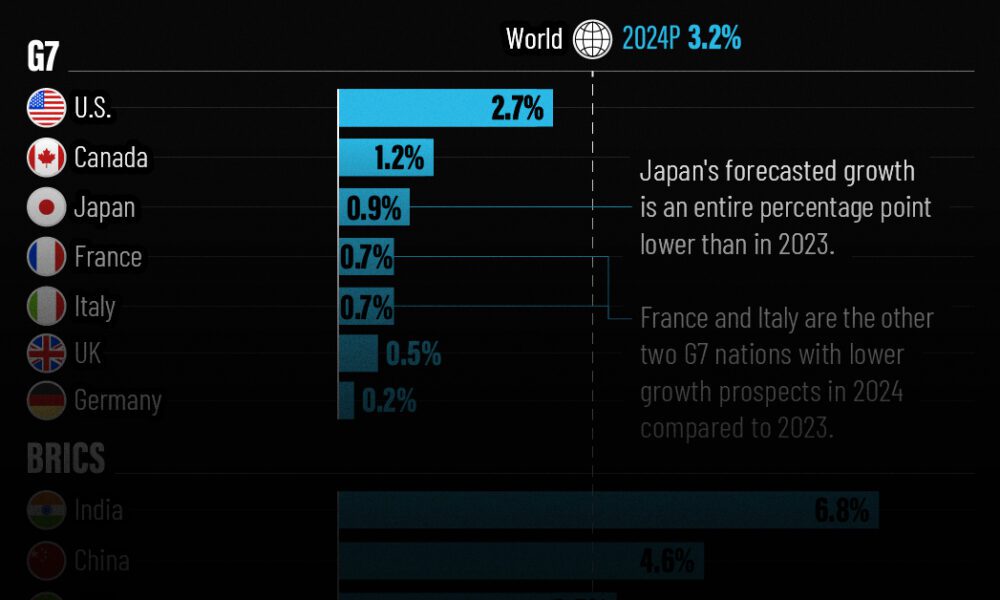
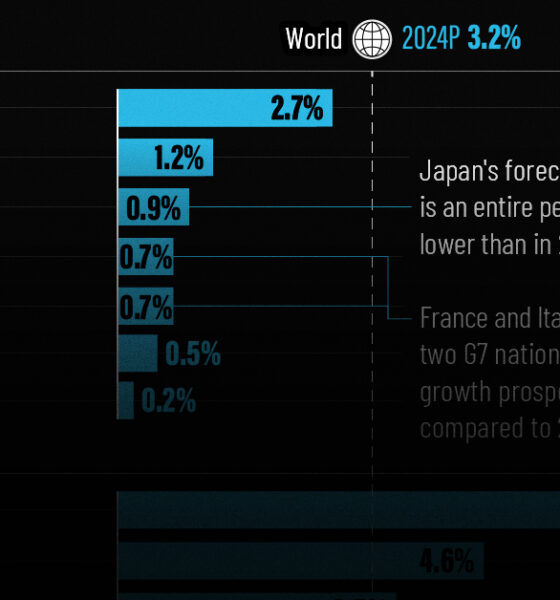
The IMF has released its economic growth forecasts for 2024. How do the G7 and BRICS countries compare?
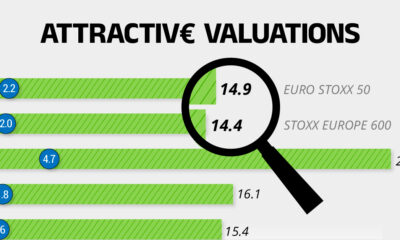

On average, the European stock market has valuations that are nearly 50% lower than U.S. valuations. But how can you access the market?


U.S. debt interest payments have surged past the $1 trillion dollar mark, amid high interest rates and an ever-expanding debt burden.


From developing an index objective to choosing relevant stocks, this graphic breaks down how MSCI builds thematic indexes using examples.


We visualized the top U.S. companies by employees, revealing the massive scale of retailers like Walmart, Target, and Home Depot.


Firing an advisor is often driven by more than cost and performance factors. Here are the top reasons clients 'break up' with their advisors.


Here are the most common drivers for hiring a financial advisor, revealing that investor motivations go beyond just financial factors.


This graphic shows the states with the highest real GDP growth rate in 2023, largely propelled by the oil and gas boom.


In this graphic, we show the highest earning flight routes globally as air travel continued to rebound in 2023.


The U.S. residential real estate market is worth a staggering $47.5 trillion. Here are the most valuable housing markets in the country.


