Money
Visualizing the Top Countries by Wealth per Person
Visualizing the Top Countries by Wealth per Person
When looking at wealth per person on a country-by-country basis, is it more important to look at median wealth or average wealth?
Many experts believe that median wealth provides the most accurate picture of wealth since it identifies the middle point of a dataset, with half of the data points above this number, and half falling below it. In this way, it is less impacted by extreme values, and gives a good representation of the “middle of the pack”.
With that said, average wealth gives you a true average, even though it may get distorted by outliers, like the fortunes held by billionaires.
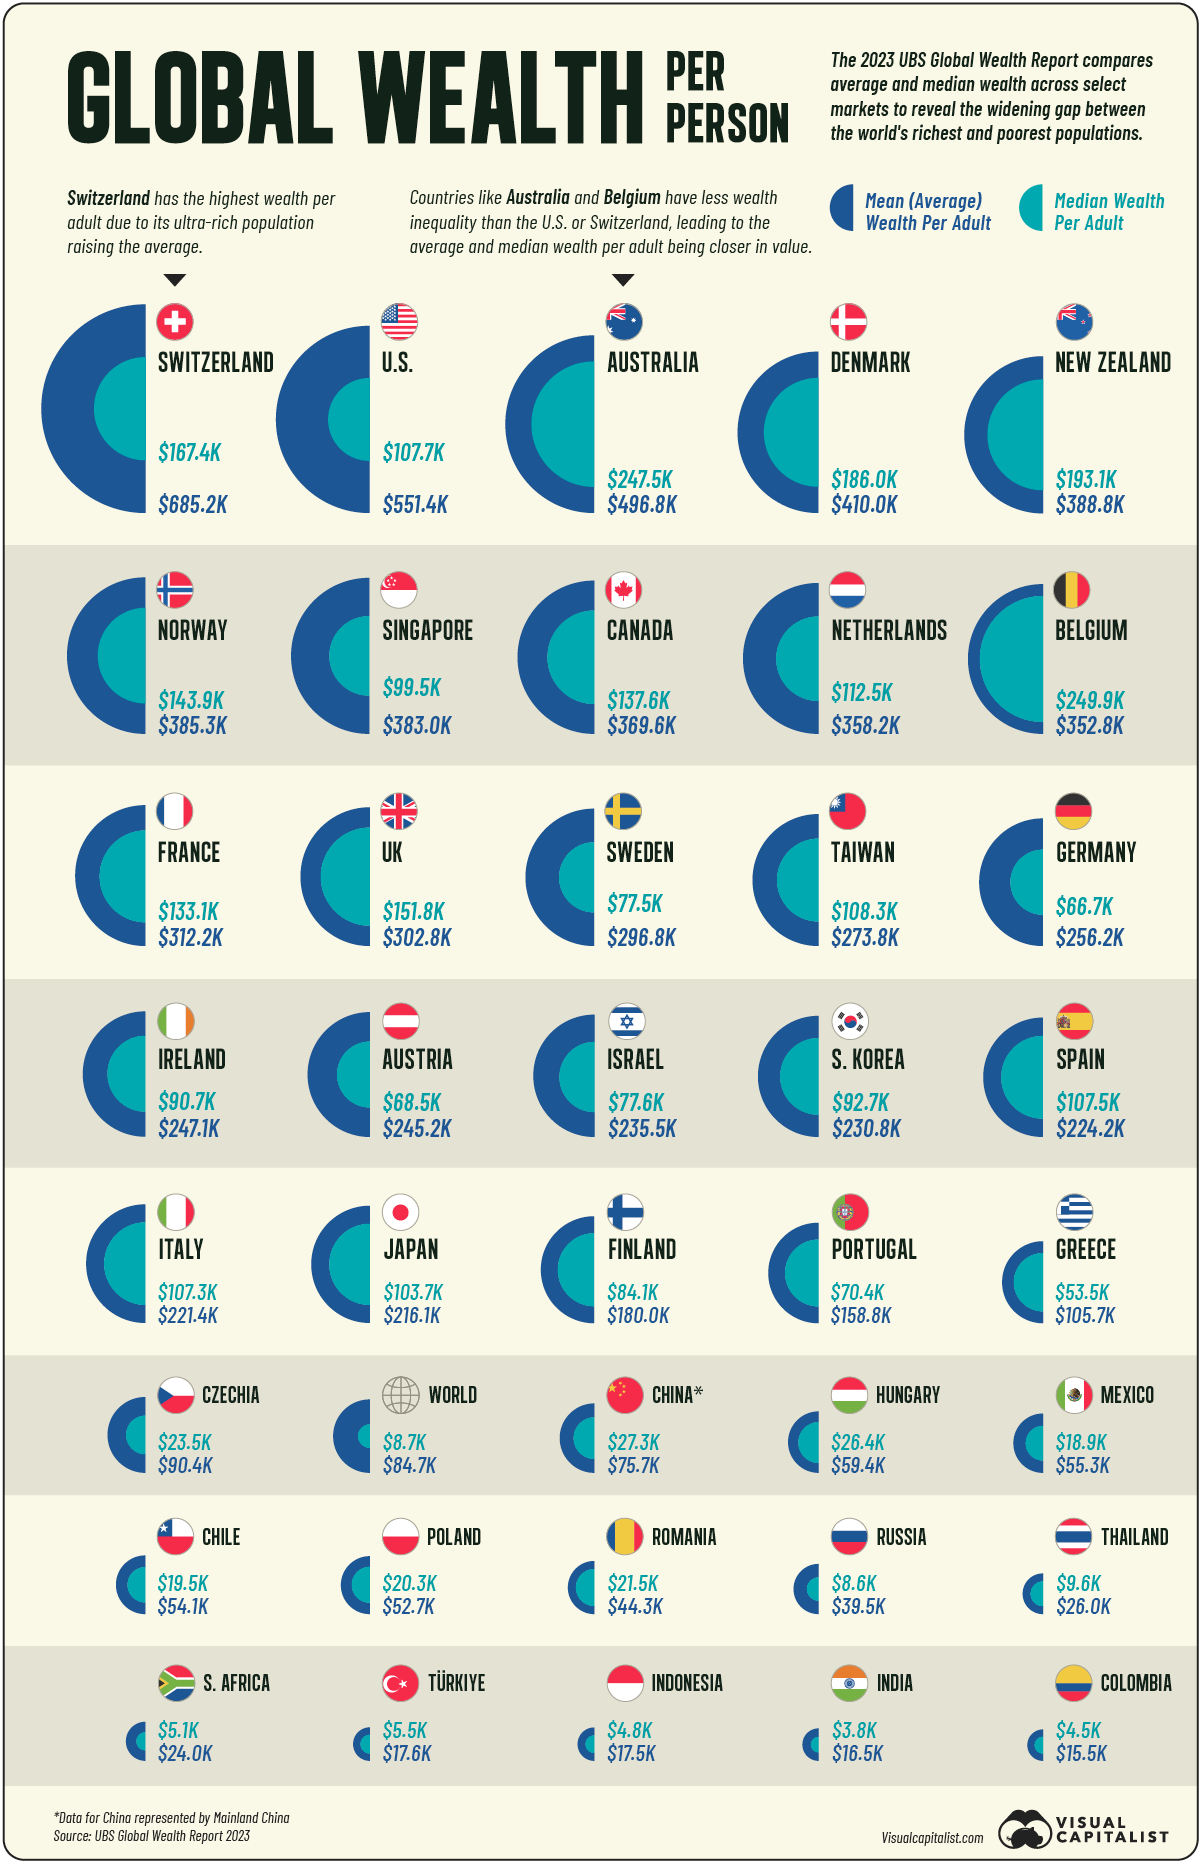
Either way, today’s graphic compares both average and median wealth across select countries, using data from the 2023 UBS Global Wealth Report.
Top Countries by Average Wealth per Person
In 2022, global average wealth per adult stood at $84,718.
By these measures, Switzerland ranks at the top at $685,226 per person. Over 15% of the population are millionaires, the third-highest rate in the world. However, when looking at median wealth per person, it stands at $167,353, a difference of over $517,000.
Like Switzerland, five of the top 10 countries by average wealth are in Western Europe, including Denmark, Norway, the Netherlands, and Belgium.
The table below shows average wealth per adult in 2022 across 39 countries analyzed by UBS:
| Rank | Country | Mean Wealth per Adult |
|---|---|---|
| 1 | 🇨🇭 Switzerland | $685,226 |
| 2 | 🇺🇸 U.S. | $551,347 |
| 3 | 🇦🇺 Australia | $496,819 |
| 4 | 🇩🇰 Denmark | $409,954 |
| 5 | 🇳🇿 New Zealand | $388,761 |
| 6 | 🇳🇴 Norway | $385,338 |
| 7 | 🇸🇬 Singapore | $382,957 |
| 8 | 🇨🇦 Canada | $369,577 |
| 9 | 🇳🇱 Netherlands | $358,235 |
| 10 | 🇧🇪 Belgium | $352,814 |
| 11 | 🇫🇷 France | $312,235 |
| 12 | 🇬🇧 UK | $302,783 |
| 13 | 🇸🇪 Sweden | $296,800 |
| 14 | 🇹🇼 Taiwan | $273,788 |
| 15 | 🇩🇪 Germany | $256,179 |
| 16 | 🇮🇪 Ireland | $247,080 |
| 17 | 🇦🇹 Austria | $245,225 |
| 18 | 🇮🇱 Israel | $235,445 |
| 19 | 🇰🇷 South Korea | $230,760 |
| 20 | 🇪🇸 Spain | $224,209 |
| 21 | 🇮🇹 Italy | $221,370 |
| 22 | 🇯🇵 Japan | $216,078 |
| 23 | 🇫🇮 Finland | $179,986 |
| 24 | 🇵🇹 Portugal | $158,840 |
| 25 | 🇬🇷 Greece | $105,724 |
| 26 | 🇨🇿 Czechia | $90,393 |
| 27 | 🇨🇳 China | $75,731 |
| 28 | 🇭🇺 Hungary | $59,348 |
| 29 | 🇲🇽 Mexico | $55,274 |
| 30 | 🇨🇱 Chile | $54,082 |
| 31 | 🇵🇱 Poland | $52,741 |
| 32 | 🇷🇴 Romania | $44,320 |
| 33 | 🇷🇺 Russia | $39,514 |
| 34 | 🇹🇭 Thailand | $25,956 |
| 35 | 🇿🇦 South Africa | $23,956 |
| 36 | 🇹🇷 Türkiye | $17,578 |
| 37 | 🇮🇩 Indonesia | $17,457 |
| 38 | 🇮🇳 India | $16,500 |
| 39 | 🇨🇴 Colombia | $15,464 |
| World | $84,718 |
The U.S. falls second, with a mean wealth per adult of $551,347.
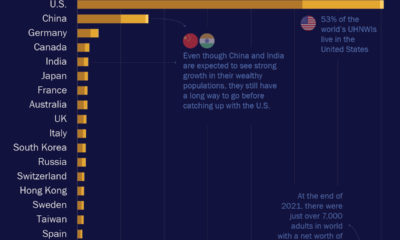
Overall, it is home to 38% of global millionaires, outpacing the second-highest country, China, by more than three times. With a significant wealth gap, income inequality in the U.S. is among the highest across developed nations.
Ranking seventh is Singapore, with the highest average wealth per adult across Asia. Income inequality in Singapore falls at a similar level to America based on its Gini ratio.
Top Countries by Median Wealth per Person
Here’s how wealth shifts when looking from a median wealth per adult basis:
| Rank | Country | Median Wealth per Adult |
|---|---|---|
| 1 | 🇧🇪 Belgium | $249,937 |
| 2 | 🇦🇺 Australia | $247,453 |
| 3 | 🇳🇿 New Zealand | $193,065 |
| 4 | 🇩🇰 Denmark | $186,041 |
| 5 | 🇨🇭 Switzerland | $167,353 |
| 6 | 🇬🇧 UK | $151,825 |
| 7 | 🇳🇴 Norway | $143,887 |
| 8 | 🇨🇦 Canada | $137,633 |
| 9 | 🇫🇷 France | $133,137 |
| 10 | 🇳🇱 Netherlands | $112,450 |
| 11 | 🇹🇼 Taiwan | $108,247 |
| 12 | 🇺🇸 U.S. | $107,739 |
| 13 | 🇪🇸 Spain | $107,507 |
| 14 | 🇮🇹 Italy | $107,315 |
| 15 | 🇯🇵 Japan | $103,681 |
| 16 | 🇸🇬 Singapore | $99,488 |
| 17 | 🇰🇷 South Korea | $92,719 |
| 18 | 🇮🇪 Ireland | $90,741 |
| 19 | 🇫🇮 Finland | $84,093 |
| 20 | 🇮🇱 Israel | $77,604 |
| 21 | 🇸🇪 Sweden | $77,515 |
| 22 | 🇵🇹 Portugal | $70,409 |
| 23 | 🇦🇹 Austria | $68,492 |
| 24 | 🇩🇪 Germany | $66,735 |
| 25 | 🇬🇷 Greece | $53,501 |
| 26 | 🇨🇳 China | $27,273 |
| 27 | 🇭🇺 Hungary | $26,416 |
| 28 | 🇨🇿 Czechia | $23,502 |
| 29 | 🇷🇴 Romania | $21,545 |
| 30 | 🇵🇱 Poland | $20,263 |
| 31 | 🇨🇱 Chile | $19,544 |
| 32 | 🇲🇽 Mexico | $18,920 |
| 33 | 🇹🇭 Thailand | $9,602 |
| 34 | 🇷🇺 Russia | $8,595 |
| 35 | 🇹🇷 Türkiye | $5,488 |
| 36 | 🇿🇦 South Africa | $5,141 |
| 37 | 🇮🇩 Indonesia | $4,819 |
| 38 | 🇨🇴 Colombia | $4,450 |
| 39 | 🇮🇳 India | $3,755 |
| World | $8,654 |
Belgium ranks the highest, climbing past Australia for the first time. High home ownership levels and elevated home prices have led household wealth to rise above other European countries.
Median wealth in the U.S. stood at $107,739, falling in 12th place.
Overall, median wealth has grown the fastest in China, increasing eightfold since 2000 to reach $27,273. The country’s rapid economic growth has lifted many into the middle class, yet wealth inequality has also increased.
Biggest Gaps in Average and Median Wealth
Which countries have the starkest difference between average and median wealth per adult?
Across the dataset, the U.S. saw the steepest gap. Median wealth per adult was $107,739—80.5% lower than average wealth levels. This means that wealth ownership skews disproportionately to the country’s richest.
Following the U.S. were South Africa, Russia, and India for illustrating the widest disparities between average and median wealth.
On the other end of the spectrum was Belgium, where median wealth per adult was the closest to average wealth levels. In this way, median wealth per person was $249,937 while average wealth was $352,814, reflecting less disparity.
Other countries with narrower gaps between median and average wealth per person included Greece, the UK, and Australia.


Wealth
Visualizing the Tax Burden of Every U.S. State
Tax burden measures the percent of an individual’s income that is paid towards taxes. See where it’s the highest by state in this graphic.


Visualizing the Tax Burden of Every U.S. State
This was originally posted on our Voronoi app. Download the app for free on iOS or Android and discover incredible data-driven charts from a variety of trusted sources.
This map graphic visualizes the total tax burden in each U.S. state as of March 2024, based on figures compiled by WalletHub.
It’s important to understand that under this methodology, the tax burden measures the percent of an average person’s income that is paid towards state and local taxes. It considers property taxes, income taxes, and sales & excise tax.
Data and Methodology
The figures we used to create this graphic are listed in the table below.
| State | Total Tax Burden |
|---|---|
| New York | 12.0% |
| Hawaii | 11.8% |
| Vermont | 11.1% |
| Maine | 10.7% |
| California | 10.4% |
| Connecticut | 10.1% |
| Minnesota | 10.0% |
| Illinois | 9.7% |
| New Jersey | 9.5% |
| Rhode Island | 9.4% |
| Utah | 9.4% |
| Kansas | 9.3% |
| Maryland | 9.3% |
| Iowa | 9.2% |
| Nebraska | 9.2% |
| Ohio | 8.9% |
| Indiana | 8.9% |
| Arkansas | 8.8% |
| Mississippi | 8.8% |
| Massachusetts | 8.6% |
| Virginia | 8.5% |
| West Virginia | 8.5% |
| Oregon | 8.4% |
| Colorado | 8.4% |
| Pennsylvania | 8.4% |
| Wisconsin | 8.3% |
| Louisiana | 8.3% |
| Kentucky | 8.3% |
| Washington | 8.0% |
| New Mexico | 8.0% |
| Michigan | 8.0% |
| North Carolina | 7.9% |
| Idaho | 7.9% |
| Arizona | 7.8% |
| Missouri | 7.8% |
| Georgia | 7.7% |
| Texas | 7.6% |
| Alabama | 7.5% |
| Montana | 7.5% |
| South Carolina | 7.5% |
| Nevada | 7.4% |
| Oklahoma | 7.0% |
| North Dakota | 6.8% |
| South Dakota | 6.4% |
| Delaware | 6.4% |
| Tennessee | 6.1% |
| Florida | 6.1% |
| Wyoming | 5.7% |
| New Hampshire | 5.6% |
| Alaska | 4.9% |
From this data we can see that New York has the highest total tax burden. Residents in this state will pay, on average, 12% of their income to state and local governments.
Breaking this down into its three components, the average New Yorker pays 4.6% of their income on income taxes, 4.4% on property taxes, and 3% in sales & excise taxes.
At the other end of the spectrum, Alaska has the lowest tax burden of any state, equaling 4.9% of income. This is partly due to the fact that Alaskans do not pay state income tax.
Hate Paying Taxes?
In addition to Alaska, there are several other U.S. states that don’t charge income taxes. These are: Florida, Nevada, South Dakota, Tennessee, Texas, Washington, and Wyoming.
It’s also worth noting that New Hampshire does not have a regular income tax, but does charge a flat 4% on interest and dividend income according to the Tax Foundation.
Learn More About Taxation From Visual Capitalist
If you enjoyed this post, be sure to check out this graphic which ranks the countries with the lowest corporate tax rates, from 1980 to today.

-

 Markets5 days ago
Visualizing Global Inflation Forecasts (2024-2026)
-

 Green2 weeks ago
The Carbon Footprint of Major Travel Methods
-

 United States2 weeks ago
Visualizing the Most Common Pets in the U.S.
-

 Culture2 weeks ago
The World’s Top Media Franchises by All-Time Revenue
-

 voronoi1 week ago
Best Visualizations of April on the Voronoi App
-

 Wealth1 week ago
Charted: Which Country Has the Most Billionaires in 2024?
-

 Business1 week ago
The Top Private Equity Firms by Country
-

 Markets1 week ago
The Best U.S. Companies to Work for According to LinkedIn