Technology
Visualizing Moore’s Law in Action (1971-2019)
Animation: Visualizing Moore’s Law in Action (1971-2019)
The pace of technological progress keeps accelerating.
There are many ways to show this, but perhaps the simplest way is to create a visual representation of Moore’s Law in action.
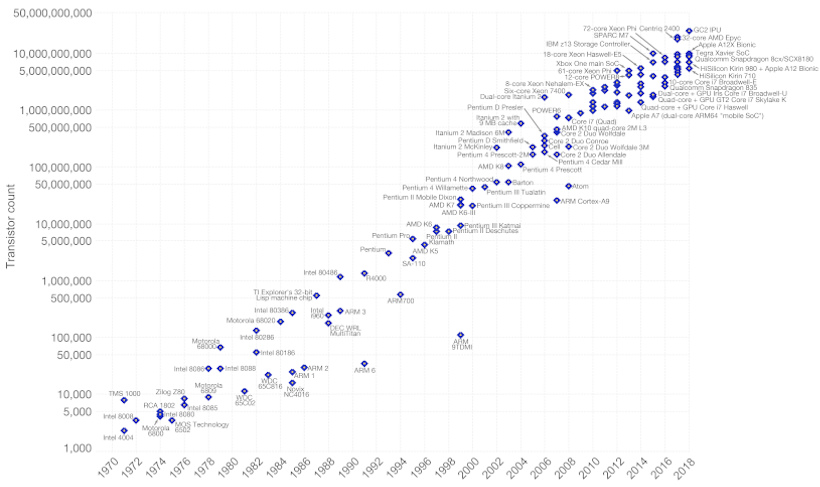
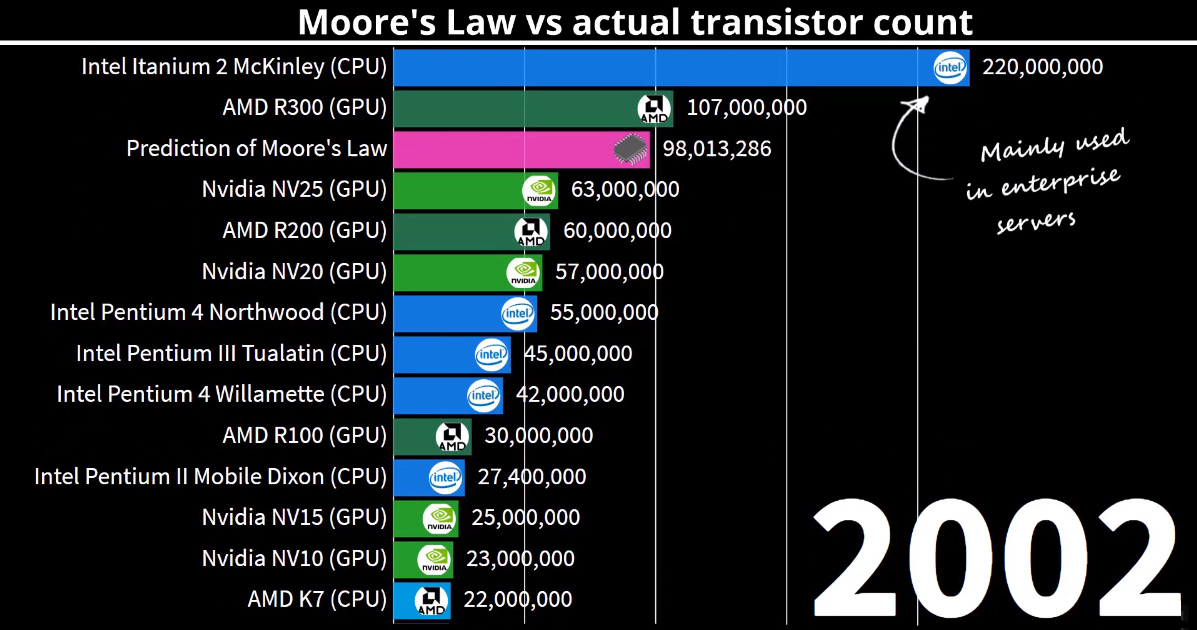
Today’s animation comes to us from DataGrapha, and it compares the predictions of Moore’s Law with data from actual computer chip innovations occurring between 1971 to 2019.
Defining Moore’s Law
Moore’s Law was originally derived from an observation by Gordon Moore, the co-founder of Fairchild Semiconductor and later the co-founder and CEO of Intel.
In 1965, Moore wrote that the number of components in a dense integrated circuit (i.e., transistors, resistors, diodes, or capacitors) had been doubling with every year of research, and he predicted that this would continue for another decade.
Later on in 1975, he revised his prediction to the doubling occurring every two years.
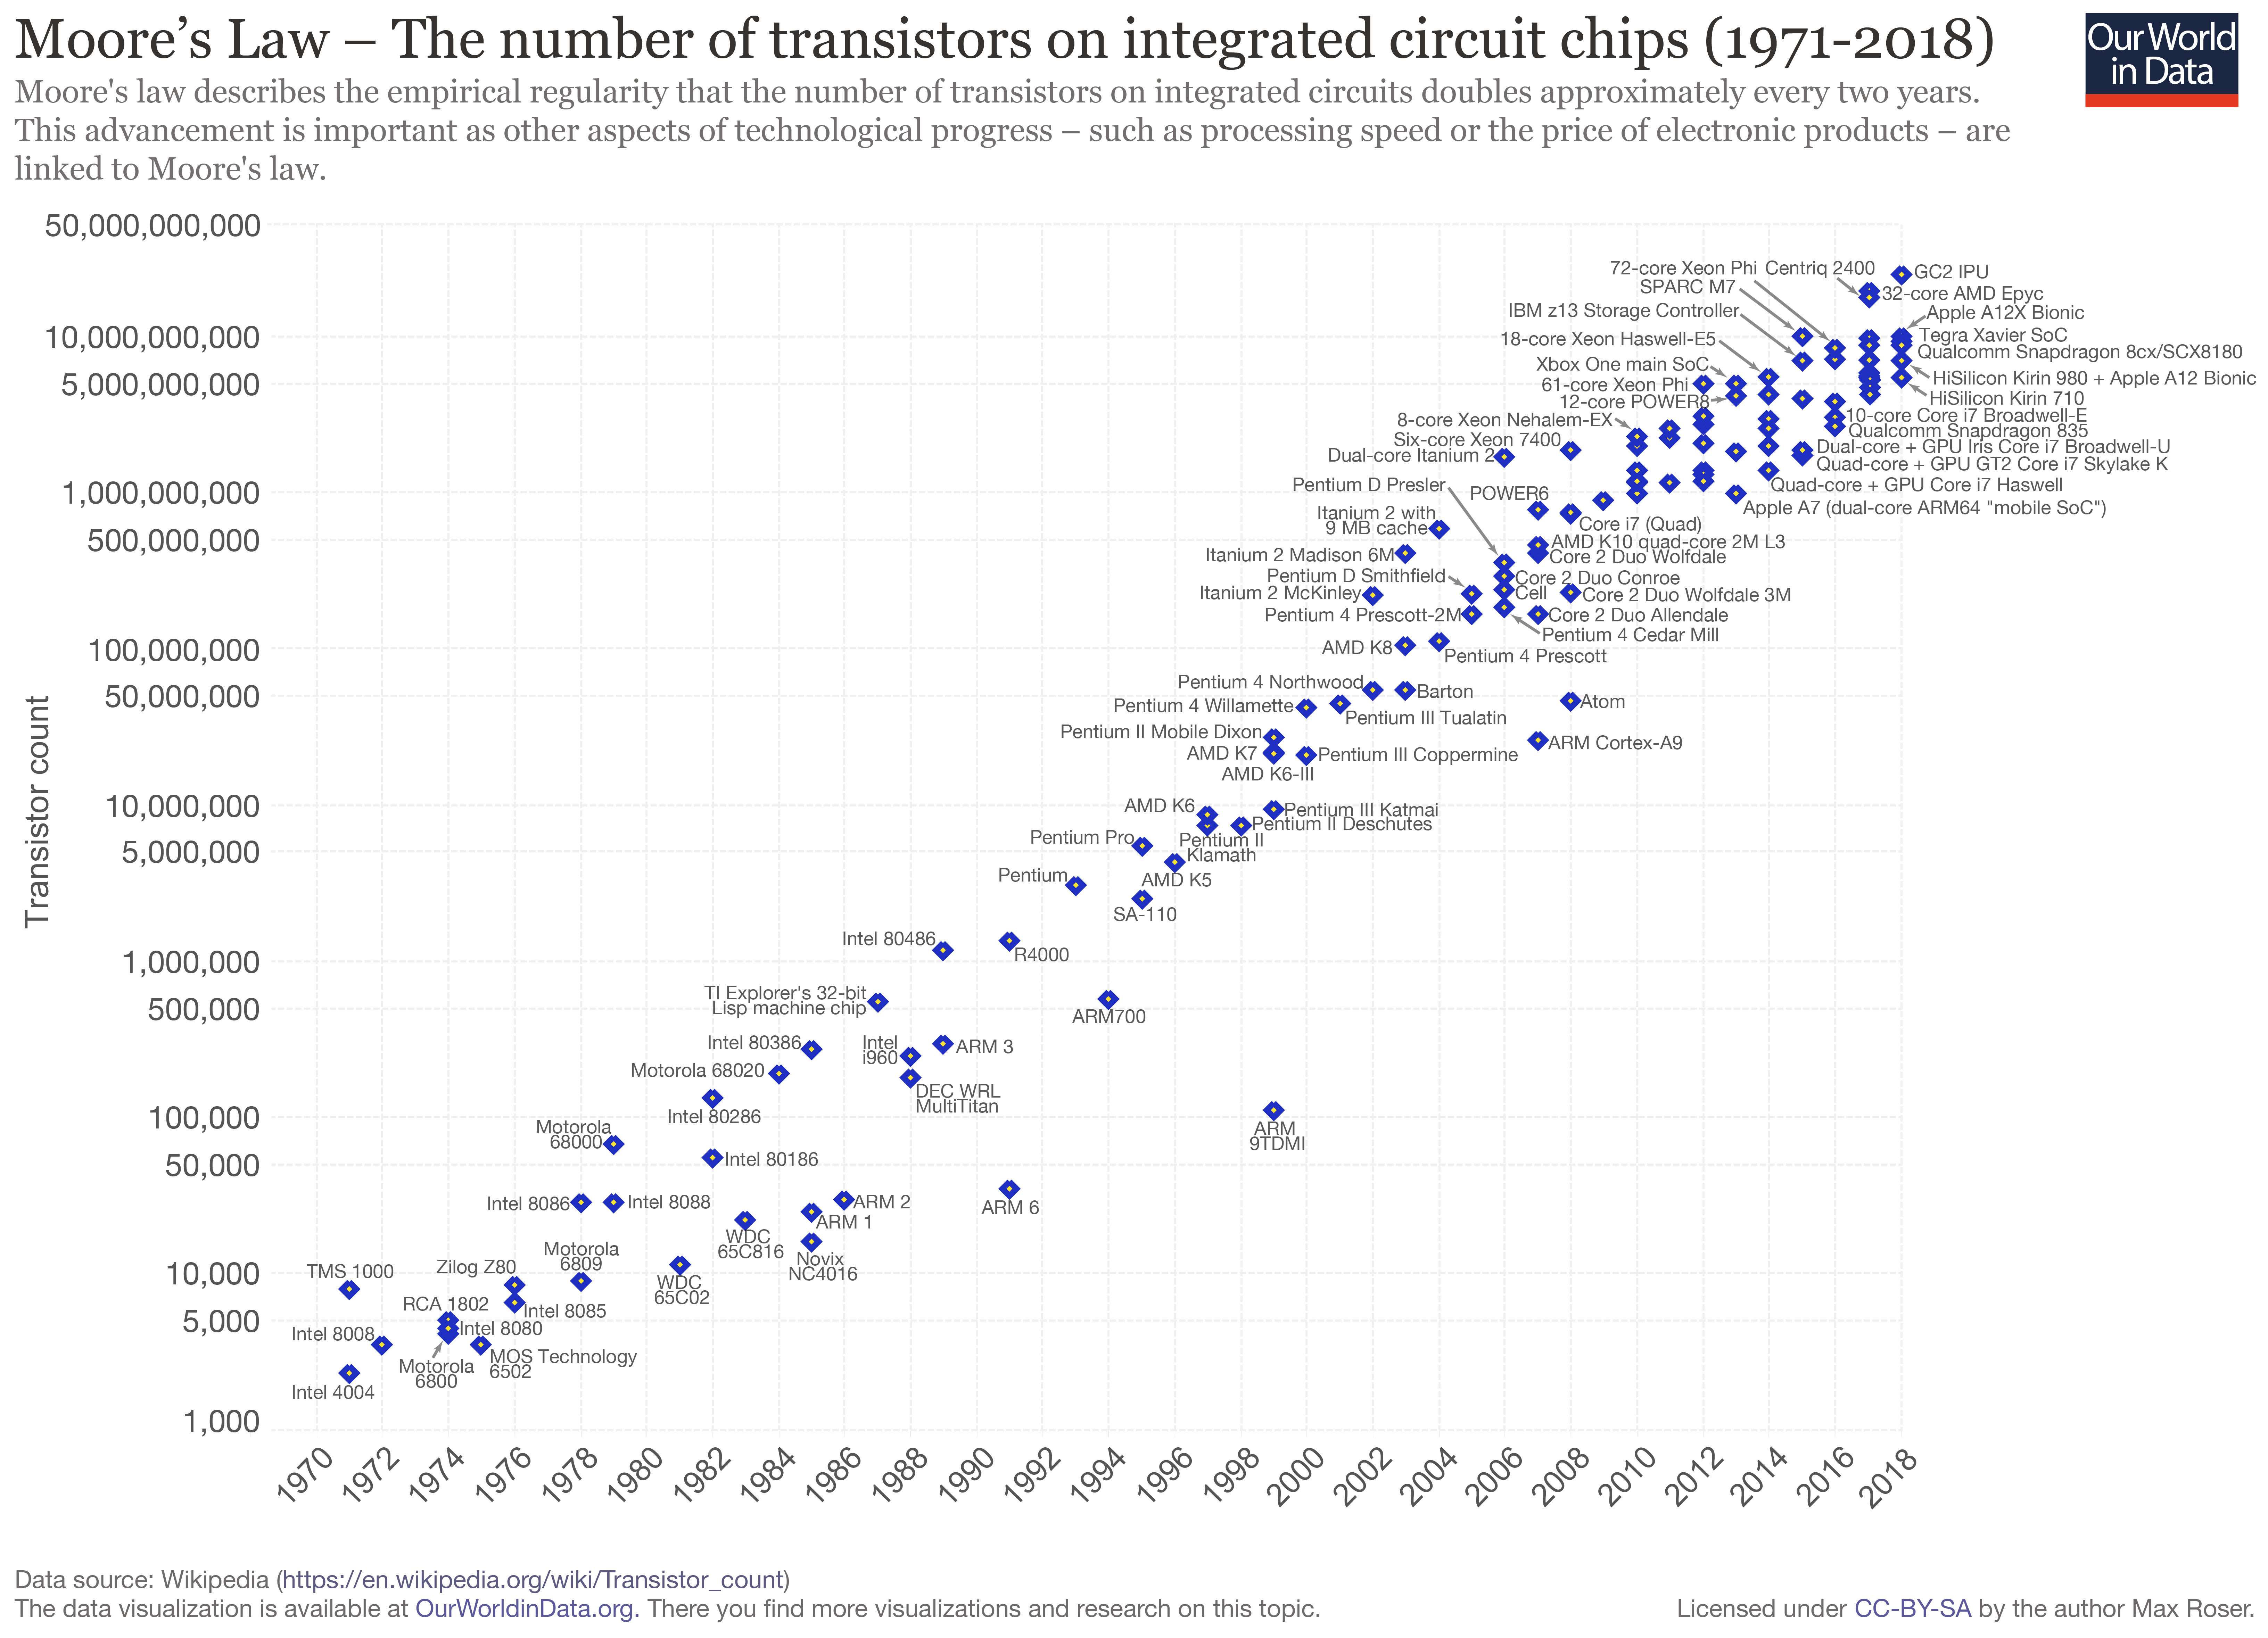
Like the animation, the following chart from Our World in Data helps plot out the predictions of Moore’s Law versus real world data — note that the Y Axis is logarithmic:
The prophetic prediction of Moore’s Law has led to exponential progress in computing — as well as for everything else touched by computers.
It’s no surprise then, especially given that the modern information age is largely driven by increasingly efficient computing, that this law has had a trickle down effect on nearly every significant aspect of global innovation.
An Accelerated Pace of Change
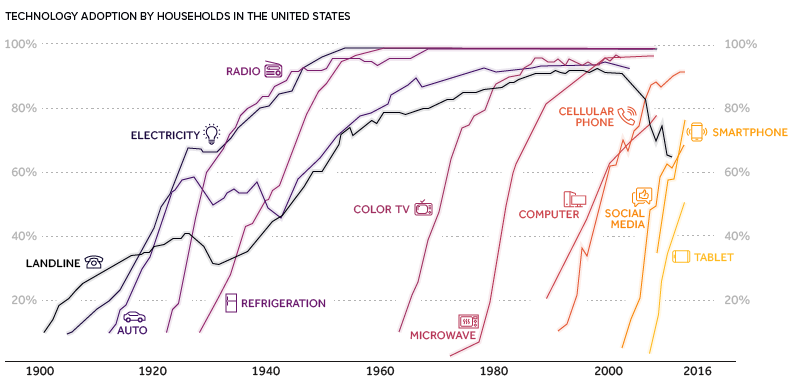
Moore’s Law has translated into a faster rate of change for society as a whole.
A new idea, like the smartphone, can get immediate traction because of instantaneous communication, increased global connectivity, and the ubiquity of information. New tech advancements can now change business or culture in a heartbeat:
Further, since software is a “layer” built upon the foundation of computing, it means that digital products can be replicated at almost no marginal cost. This is why a phenomenon like Pokémon Go was able to captivate 50 million users in just 19 days.
Imagine this kind of scalability, when applied to things like artificial intelligence or virtual reality.
Is Moore’s Law Dead or Alive?
As with any enduring prediction, there are always naysayers out there that will boldly forecast an imminent end to the trend.
Since the 2000s, there has been an ongoing debate within the semiconductor community on whether Moore’s Law will continue its reign, or if progress will ultimately sputter out as certain physical limitations catch up with the process of miniaturization.
Earlier in 2019, Nvidia CEO Jensen Huang declared that Moore’s Law is no longer possible. For what it’s worth, Intel still says technology in chipmaking always finds a way to advance — while TSMC has recently said the law is actually alive and well.
Regardless of who is right, Moore’s Law has held true for close to 50 years, and its repercussions will continue to be felt in almost every aspect of life and society going forward.


Technology
Countries With the Highest Rates of Crypto Ownership
While the U.S. is a major market for cryptocurrencies, two countries surpass it in terms of their rates of crypto ownership.


Countries With the Highest Rates of Crypto Ownership
This was originally posted on our Voronoi app. Download the app for free on iOS or Android and discover incredible data-driven charts from a variety of trusted sources.
This graphic ranks the top 10 countries by their rate of cryptocurrency ownership, which is the percentage of the population that owns crypto. These figures come from crypto payment gateway, Triple-A, and are as of 2023.
Data and Highlights
The table below lists the rates of crypto ownership in the top 10 countries, as well as the number of people this amounts to.
| Country | % of Population Who Own Crypto | # of Crypto Owners |
|---|---|---|
| 🇦🇪 United Arab Emirates | 30.4 | 3M |
| 🇻🇳 Vietnam | 21.2 | 21M |
| 🇺🇸 U.S. | 15.6 | 53M |
| 🇮🇷 Iran | 13.5 | 12M |
| 🇵🇭 Philippines | 13.4 | 16M |
| 🇧🇷 Brazil | 12 | 26M |
| 🇸🇦 Saudi Arabia | 11.4 | 4M |
| 🇸🇬 Singapore | 11.1 | 665K |
| 🇺🇦 Ukraine | 10.6 | 4M |
| 🇻🇪 Venezuela | 10.3 | 3M |
Note that if we were to rank countries based on their actual number of crypto owners, India would rank first at 93 million people, China would rank second at 59 million people, and the U.S. would rank third at 52 million people.
The UAE Takes the Top Spot
The United Arab Emirates (UAE) boasts the highest rates of crypto ownership globally. The country’s government is considered to be very crypto friendly, as described in Henley & Partners’ Crypto Wealth Report 2023:
In the UAE, the Financial Services Regulatory Authority (FSRA-ADGM) was the first to provide rules and regulations regarding cryptocurrency purchasing and selling. The Emirates are generally very open to new technologies and have proposed zero taxes for crypto owners and businesses.
Vietnam leads Southeast Asia
According to the Crypto Council for Innovation, cryptocurrency holdings in Vietnam are also untaxed, making them an attractive asset.
Another reason for Vietnam’s high rates of ownership could be its large unbanked population (people without access to financial services). Cryptocurrencies may provide an alternative means of accessing these services without relying on traditional banks.
Learn More About Crypto From Visual Capitalist
If you enjoyed this post, be sure to check out The World’s Largest Corporate Holders of Bitcoin, which ranks the top 12 publicly traded companies by their Bitcoin holdings.

-

 Markets6 days ago
Visualized: Interest Rate Forecasts for Advanced Economies
-

 Markets2 weeks ago
Economic Growth Forecasts for G7 and BRICS Countries in 2024
-

 Wealth2 weeks ago
Charted: Which City Has the Most Billionaires in 2024?
-

 Technology2 weeks ago
All of the Grants Given by the U.S. CHIPS Act
-

 Green2 weeks ago
The Carbon Footprint of Major Travel Methods
-

 United States1 week ago
Visualizing the Most Common Pets in the U.S.
-

 Culture1 week ago
The World’s Top Media Franchises by All-Time Revenue
-

 voronoi1 week ago
Best Visualizations of April on the Voronoi App