Sponsored
Visualizing Carbon Storage in Earth’s Ecosystems
The following content is sponsored by the Carbon Streaming Corporation.

Visualizing Carbon Storage in Earth’s Ecosystems
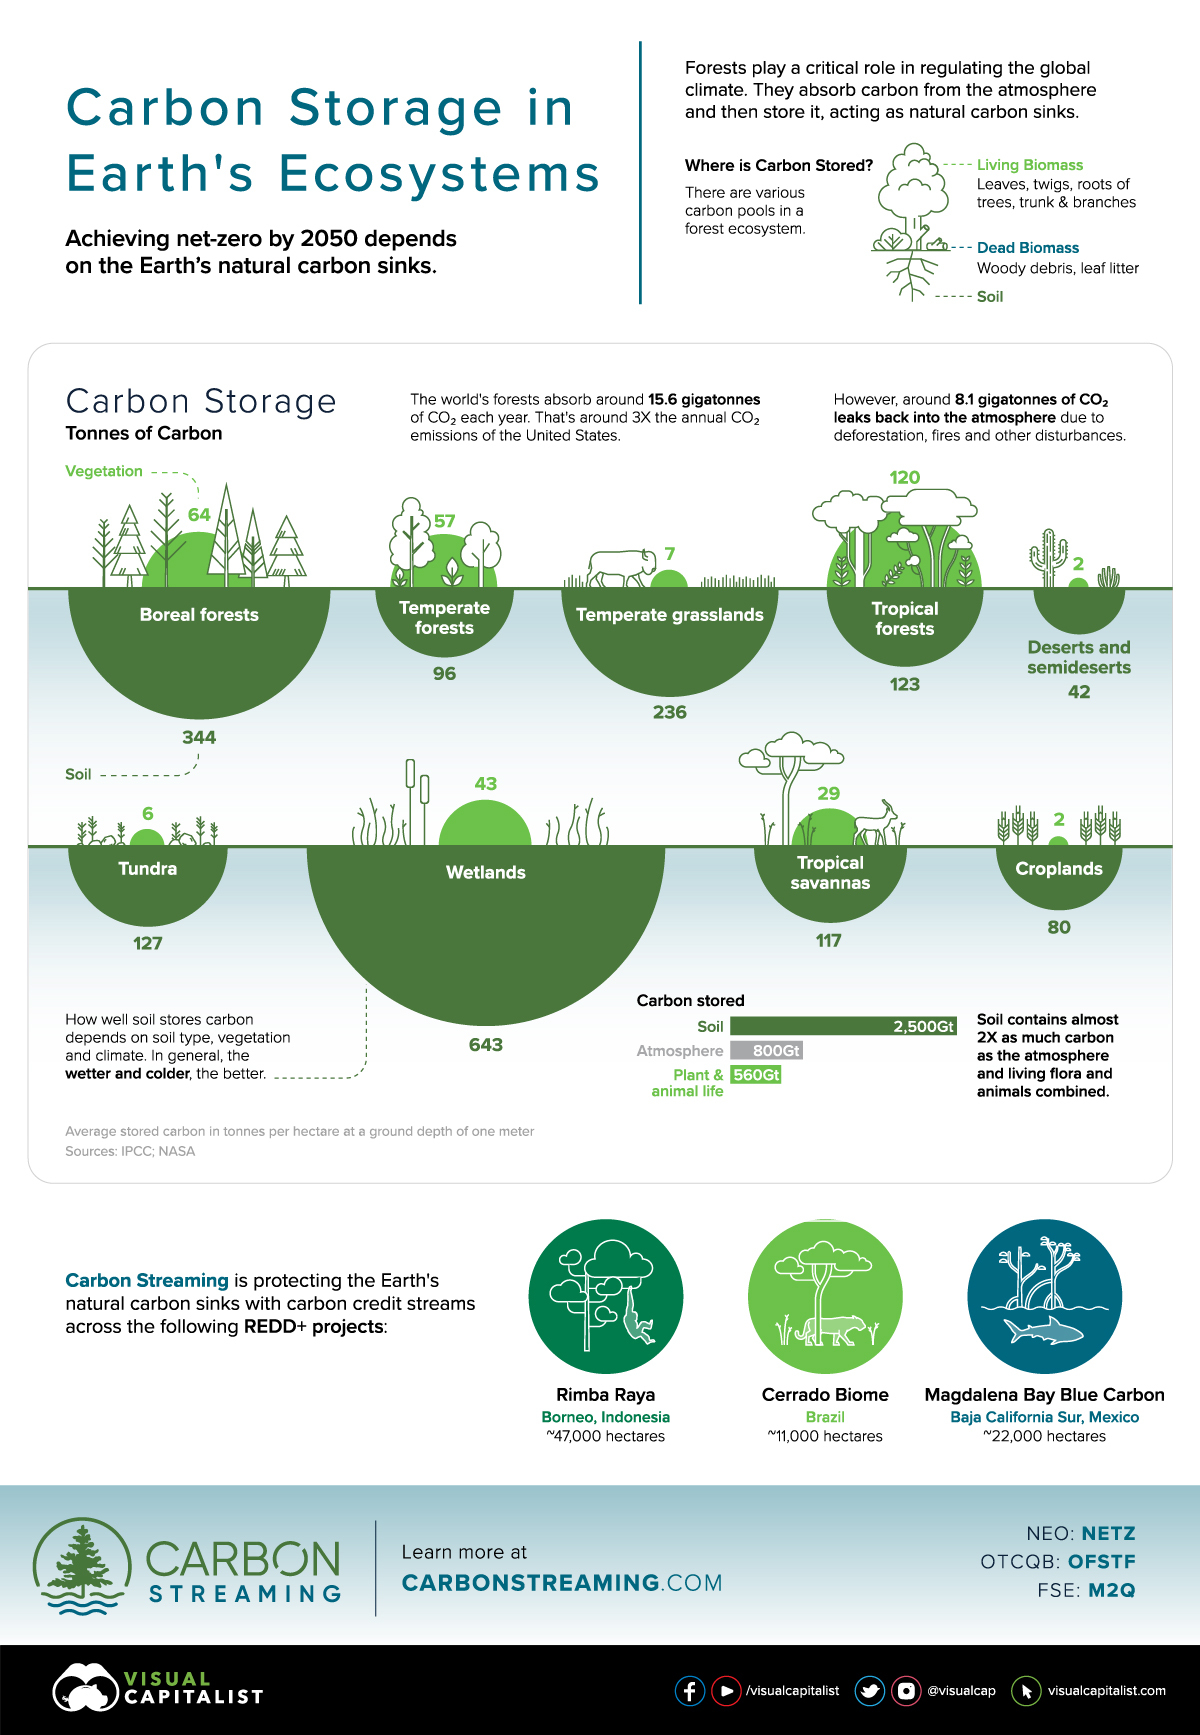
Each year, the world’s forests absorb roughly 15.6 billion tonnes of carbon dioxide (CO2).
To put it in perspective, that’s around three times the annual CO2 emissions of the U.S. or about 40% of global CO2 emissions. For this reason, forests serve as a vital tool in regulating the global temperature and achieving net-zero emissions by 2050.
In this graphic sponsored by Carbon Streaming Corporation, we look at the Earth’s natural carbon sinks, and break down their carbon storage.
Carbon Storage by Ecosystem
Forests contain several carbon sinks, from living biomass such as roots and leaves to soil. In fact, soil contains nearly twice as much carbon than the atmosphere, plant, and animal life combined.
- Soil: 2,500 gigatonnes (Gt)
- Atmosphere: 800 Gt
- Plant & animal life: 560 Gt
The soil type, vegetation, and climate all affect how carbon is stored. For example, colder and wetter climates promote the most effective carbon storage in soil.
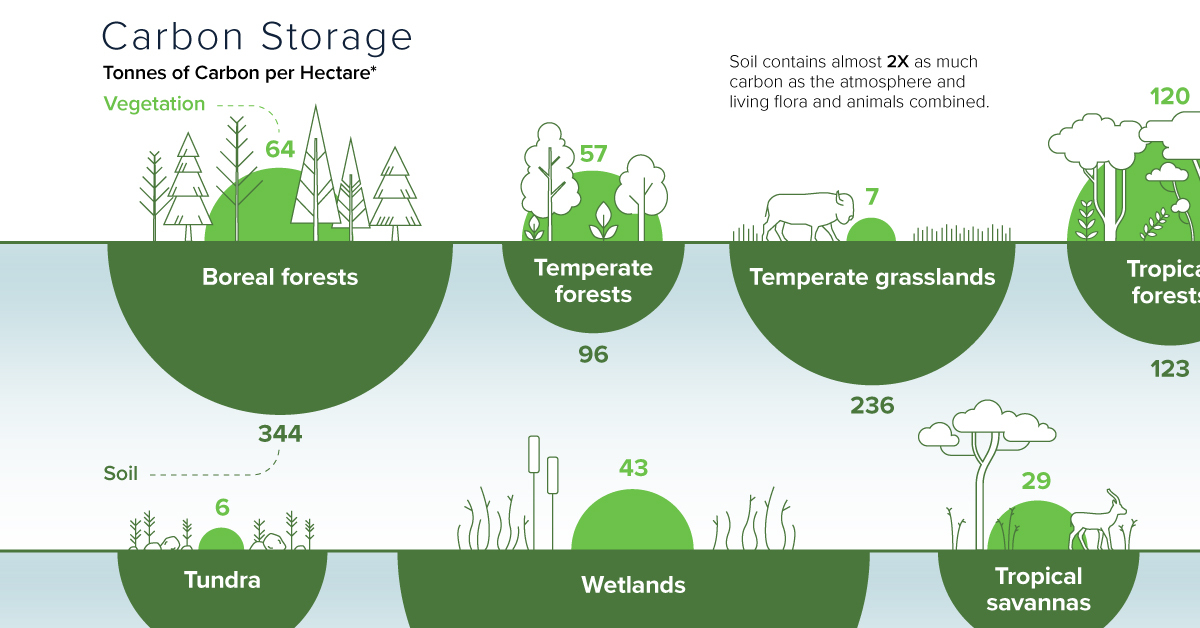
Global Carbon Storage* (Tonnes of carbon per hectare) | Vegetation | Soil |
---|---|---|
Wetlands | 43 | 643 |
Boreal forests | 64 | 344 |
Temperate grasslands | 7 | 236 |
Tundra | 6 | 127 |
Tropical forests | 120 | 123 |
Tropical savannas | 29 | 117 |
Temperate forests | 57 | 96 |
Croplands | 2 | 80 |
Deserts and semideserts | 2 | 42 |
*Average stored carbon in tonnes per hectare at a ground depth of one meter
Source: IPCC
Wetlands are substantial reservoirs of carbon. Despite occupying only 5-8% of the Earth’s land surface, they hold between 20 to 30% of all estimated organic soil carbon.
Risks to Natural Carbon Sinks
Around 8.1 billion tonnes of CO2 leaks back into the atmosphere each year.
Over the last 20 years, the world has lost about 10% of its tree cover, or 411 million hectares (Mha). The main causes behind this are forestry (119 Mha), commodity-driven deforestation (103 Mha), and wildfires (89 Mha). What’s more, research suggests that Amazon rainforests emit more carbon than they absorb due to record levels of fires, many of which are deliberately set to clear for commodity production.
With the increasing frequency of wildfires and deforestation, the world’s forests are at risk of releasing carbon. Protecting and preserving these biomes is critical to the Earth’s carbon balance and mitigating climate change.
Carbon Credits Provide a Solution
Given the risk of losing critical carbon sinks, carbon credits play an important role in preserving these ecosystems.
Carbon credits can help finance projects that reduce or remove GHG emissions from the atmosphere. From improved forest management to reforestation, there are a number of different types of carbon projects across wetlands, grasslands, and various forests:
- Reforestation and Afforestation
- Avoided Deforestation
- Natural forest management
- Wetland restoration
For instance, a carbon credit project may preserve endangered tropical lowland peat swamp forests spanning thousands of hectares, such as the Rimba Raya Biodiversity Reserve Project in Indonesia, one of the projects that Carbon Streaming has a carbon credit stream.
Through this project, forests are prevented from being converted into palm oil plantations to reduce and avoid 130 million tonnes of GHG emissions during the 30 years of the project.
Another example would be the Cerrado Biome Project in Brazil, another carbon offset project where Carbon Streaming has a stream agreement. This project is protecting and preserving native forests and grasslands from being converted to commercial agriculture.
Importantly, these projects would not be economically viable without the sale of carbon credits.
Protecting Stored Carbon
To prevent further loss of stored carbon, government policies, NGO-led initiatives, and the financing of carbon offset projects are gaining momentum. Taken together, they offer the critical intervention needed to preserve the earth’s carbon vaults.
Sponsored
Ranked: Emissions per Capita of the Top 30 U.S. Investor-Owned Utilities
Roughly 25% of all GHG emissions come from electricity production. See how the top 30 IOUs rank by emissions per capita.

Emissions per Capita of the Top 30 U.S. Investor-Owned Utilities
Approximately 25% of all U.S. greenhouse gas emissions (GHG) come from electricity generation.
Subsequently, this means investor-owned utilities (IOUs) will have a crucial role to play around carbon reduction initiatives. This is particularly true for the top 30 IOUs, where almost 75% of utility customers get their electricity from.
This infographic from the National Public Utilities Council ranks the largest IOUs by emissions per capita. By accounting for the varying customer bases they serve, we get a more accurate look at their green energy practices. Here’s how they line up.
Per Capita Rankings
The emissions per capita rankings for the top 30 investor-owned utilities have large disparities from one another.
Totals range from a high of 25.8 tons of CO2 per customer annually to a low of 0.5 tons.
Utility | Emissions Per Capita (CO2 tons per year) | Total Emissions (M) |
---|---|---|
TransAlta | 25.8 | 16.3 |
Vistra | 22.4 | 97.0 |
OGE Energy | 21.5 | 18.2 |
AES Corporation | 19.8 | 49.9 |
Southern Company | 18.0 | 77.8 |
Evergy | 14.6 | 23.6 |
Alliant Energy | 14.4 | 14.1 |
DTE Energy | 14.2 | 29.0 |
Berkshire Hathaway Energy | 14.0 | 57.2 |
Entergy | 13.8 | 40.5 |
WEC Energy | 13.5 | 22.2 |
Ameren | 12.8 | 31.6 |
Duke Energy | 12.0 | 96.6 |
Xcel Energy | 11.9 | 43.3 |
Dominion Energy | 11.0 | 37.8 |
Emera | 11.0 | 16.6 |
PNM Resources | 10.5 | 5.6 |
PPL Corporation | 10.4 | 28.7 |
American Electric Power | 9.2 | 50.9 |
Consumers Energy | 8.7 | 16.1 |
NRG Energy | 8.2 | 29.8 |
Florida Power and Light | 8.0 | 41.0 |
Portland General Electric | 7.6 | 6.9 |
Fortis Inc. | 6.1 | 12.6 |
Avangrid | 5.1 | 11.6 |
PSEG | 3.9 | 9.0 |
Exelon | 3.8 | 34.0 |
Consolidated Edison | 1.6 | 6.3 |
Pacific Gas and Electric | 0.5 | 2.6 |
Next Era Energy Resources | 0 | 1.1 |
PNM Resources data is from 2019, all other data is as of 2020
Let’s start by looking at the higher scoring IOUs.
TransAlta
TransAlta emits 25.8 tons of CO2 emissions per customer, the largest of any utility on a per capita basis. Altogether, the company’s 630,000 customers emit 16.3 million metric tons. On a recent earnings call, its management discussed clear intent to phase out coal and grow their renewables mix by doubling their renewables fleet. And so far it appears they’ve been making good on their promise, having shut down the Canadian Highvale coal mine recently.
Vistra
Vistra had the highest total emissions at 97 million tons of CO2 per year and is almost exclusively a coal and gas generator. However, the company announced plans for 60% reductions in CO2 emissions by 2030 and is striving to be carbon neutral by 2050. As the highest total emitter, this transition would make a noticeable impact on total utility emissions if successful.
Currently, based on their 4.3 million customers, Vistra sees per capita emissions of 22.4 tons a year. The utility is a key electricity provider for Texas, ad here’s how their electricity mix compares to that of the state as a whole:
Energy Source | Vistra | State of Texas |
---|---|---|
Gas | 63% | 52% |
Coal | 29% | 15% |
Nuclear | 6% | 9% |
Renewables | 1% | 24% |
Oil | 1% | 0% |
Despite their ambitious green energy pledges, for now only 1% of Vistra’s electricity comes from renewables compared to 24% for Texas, where wind energy is prospering.
Based on those scores, the average customer from some of the highest emitting utility groups emit about the same as a customer from each of the bottom seven, who clearly have greener energy practices. Let’s take a closer look at emissions for some of the bottom scoring entities.
Utilities With The Greenest Energy Practices
Groups with the lowest carbon emission scores are in many ways leaders on the path towards a greener future.
Exelon
Exelon emits only 3.8 tons of CO2 emissions per capita annually and is one of the top clean power generators across the Americas. In the last decade they’ve reduced their GHG emissions by 18 million metric tons, and have recently teamed up with the state of Illinois through the Clean Energy Jobs Act. Through this, Exelon will receive $700 million in subsidies as it phases out coal and gas plants to meet 2030 and 2045 targets.
Consolidated Edison
Consolidated Edison serves nearly 4 million customers with a large chunk coming from New York state. Altogether, they emit 1.6 tons of CO2 emissions per capita from their electricity generation.
The utility group is making notable strides towards a sustainable future by expanding its renewable projects and testing higher capacity limits. In addition, they are often praised for their financial management and carry the title of dividend aristocrat, having increased their dividend for 47 years and counting. In fact, this is the longest out of any utility company in the S&P 500.
A Sustainable Tomorrow
Altogether, utilities will have a pivotal role to play in decarbonization efforts. This is particularly true for the top 30 U.S. IOUs, who collectively serve 60 million Americans, or one-fifth of the U.S. population.
Ultimately, this means a unique moment for utilities is emerging. As the transition toward cleaner energy continues and various groups push to achieve their goals, all eyes will be on utilities to deliver.
The National Public Utilities Council is the go-to resource to learn how utilities can lead in the path towards decarbonization.
Sponsored
The Road to Decarbonization: How Asphalt is Affecting the Planet
The U.S. alone generates ∼12 million tons of asphalt shingles tear-off waste and installation scrap every year and more than 90% of it is dumped into landfills.

The Road to Decarbonization: How Asphalt is Affecting the Planet
Asphalt, also known as bitumen, has various applications in the modern economy, with annual demand reaching 110 million tons globally.
Until the 20th century, natural asphalt made from decomposed plants accounted for the majority of asphalt production. Today, most asphalt is refined from crude oil.
This graphic, sponsored by Northstar Clean Technologies, shows how new technologies to reuse and recycle asphalt can help protect the environment.
The Impact of Climate Change
Pollution from vehicles is expected to decline as electric vehicles replace internal combustion engines.
But pollution from asphalt could actually increase in the next decades because of rising temperatures in some parts of the Earth. When subjected to extreme temperatures, asphalt releases harmful greenhouse gases (GHG) into the atmosphere.
Emissions from Road Construction (Source) | CO2 equivalent (%) |
---|---|
Asphalt | 28% |
Concrete | 18% |
Excavators and Haulers | 16% |
Trucks | 13% |
Crushing Plant | 10% |
Galvanized Steel | 6% |
Reinforced Steel | 6% |
Plastic Piping | 2% |
Geotextile | 1% |
Asphalt paved surfaces and roofs make up approximately 45% and 20% of surfaces in U.S. cities, respectively. Furthermore, 75% of single-family detached homes in Canada and the U.S. have asphalt shingles on their roofs.
Reducing the Environmental Impact of Asphalt
Similar to roads, asphalt shingles have oil as the primary component, which is especially harmful to the environment.
Shingles do not decompose or biodegrade. The U.S. alone generates ∼12 million tons of asphalt shingles tear-off waste and installation scrap every year and more than 90% of it is dumped into landfills, the equivalent of 20 million barrels of oil.
But most of it can be reused, rather than taking up valuable landfill space.
Using technology, the primary components in shingles can be repurposed into liquid asphalt, aggregate, and fiber, for use in road construction, embankments, and new shingles.
Providing the construction industry with clean, sustainable processing solutions is also a big business opportunity. Canada alone is a $1.3 billion market for recovering and reprocessing shingles.
Northstar Clean Technologies is the only public company that repurposes 99% of asphalt shingles components that otherwise go to landfills.
-
Misc5 days ago
The Top 10 Largest Nuclear Explosions, Visualized
-
Technology3 weeks ago
How Do Big Tech Giants Make Their Billions?
-
Green4 weeks ago
Visualizing All Electric Car Models Available in the U.S.
-
Markets4 weeks ago
Satellite Maps: Shanghai’s Supply Chain Standstill
-
Energy1 week ago
Mapped: Solar and Wind Power by Country
-
Datastream3 weeks ago
Visualizing Companies with the Most Patents Granted in 2021
-
Markets3 weeks ago
Why Investors Tuned Out Netflix
-
Technology1 week ago
Synthetic Biology: The $3.6 Trillion Science Changing Life as We Know It