Mining
Visualizing 50 Years of Global Steel Production
![]() Subscribe to the Elements free mailing list for more like this
Subscribe to the Elements free mailing list for more like this
Visualizing 50 Years of Global Steel Production
This was originally posted on Elements. Sign up to the free mailing list to get beautiful visualizations on natural resource megatrends in your email every week.
From the bronze age to the iron age, metals have defined eras of human history. If our current era had to be defined similarly, it would undoubtedly be known as the steel age.
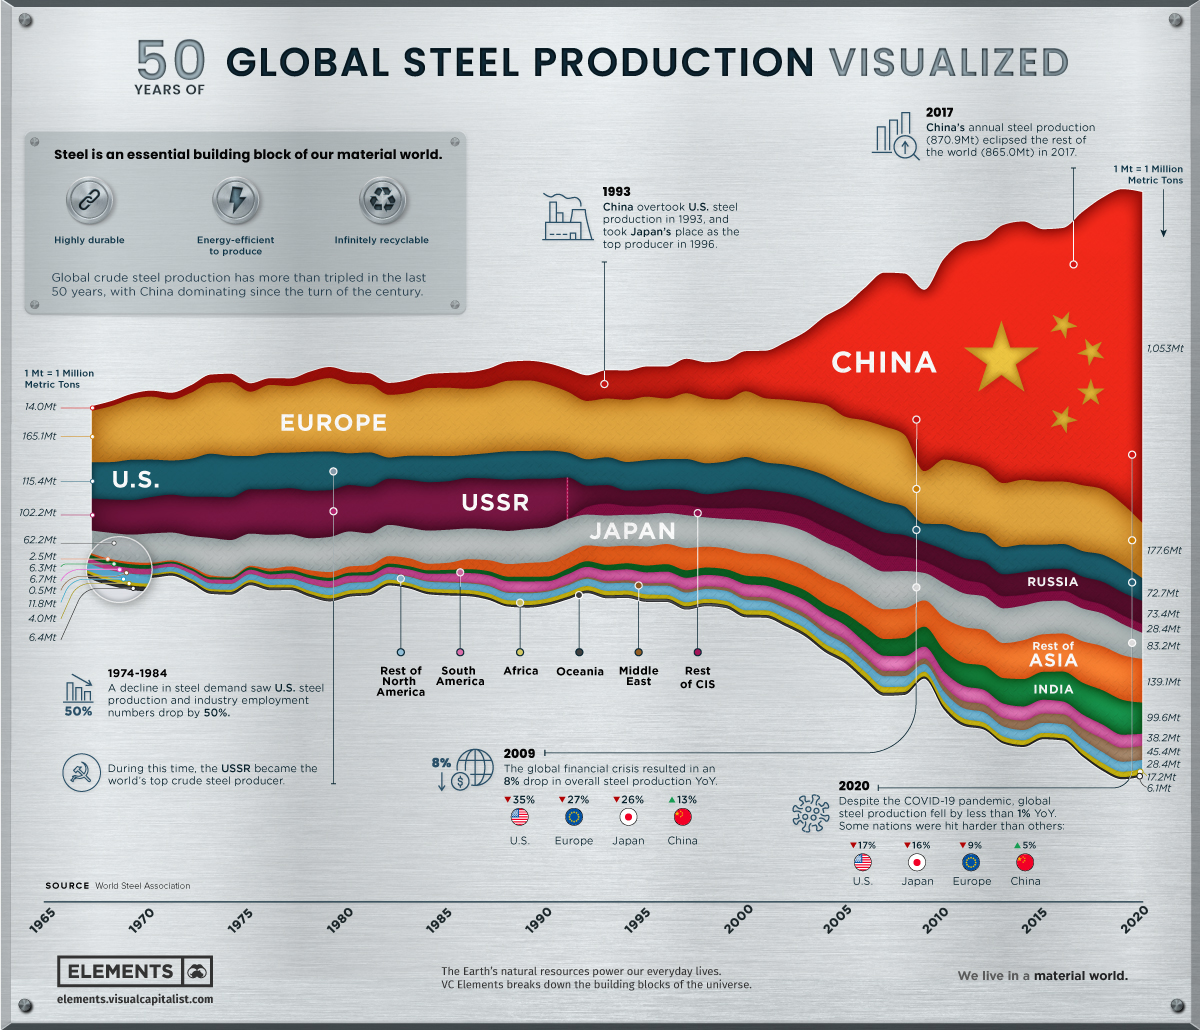
Steel is the foundation of our buildings, vehicles, and industries, with its rates of production and consumption often seen as markers for a nation’s development. Today, it is the world’s most commonly used metal and most recycled material, with 1,864 million metric tons of crude steel produced in 2020.
This infographic uses data from the World Steel Association to visualize 50 years of crude steel production, showcasing our world’s unrelenting creation of this essential material.
The State of Steel Production
Global steel production has more than tripled over the past 50 years, despite nations like the U.S. and Russia scaling down their domestic production and relying more on imports. Meanwhile, China and India have consistently grown their production to become the top two steel producing nations.
Below are the world’s current top crude steel producing nations by 2020 production.
| Rank | Country | Steel Production (2020, Mt) |
|---|---|---|
| #1 | 🇨🇳 China | 1,053.0 |
| #2 | 🇮🇳 India | 99.6 |
| #3 | 🇯🇵 Japan | 83.2 |
| #4 | 🇷🇺 Russia* | 73.4 |
| #5 | 🇺🇸 United States | 72.7 |
| #6 | 🇰🇷 South Korea | 67.1 |
| #7 | 🇹🇷 Turkey | 35.8 |
| #8 | 🇩🇪 Germany | 35.7 |
| #9 | 🇧🇷 Brazil | 31.0 |
| #10 | 🇮🇷 Iran* | 29.0 |
Source: World Steel Association. *Estimates.
Despite its current dominance, China could be preparing to scale back domestic steel production to curb overproduction risks and ensure it can reach carbon neutrality by 2060.
As iron ore and steel prices have skyrocketed in the last year, U.S. demand could soon lessen depending on the Biden administration’s actions. A potential infrastructure bill would bring investment into America’s steel mills to build supply for the future, and any walkbalk on the Trump administration’s 2018 tariffs on imported steel could further soften supply constraints.
Steel’s Secret: Infinite Recyclability
Made up primarily of iron ore, steel is an alloy which also contains less than 2% carbon and 1% manganese and other trace elements. While the defining difference might seem small, steel can be 1,000x stronger than iron.
However, steel’s true strength lies in its infinite recyclability with no loss of quality. No matter the grade or application, steel can always be recycled, with new steel products containing 30% recycled steel on average.
The alloy’s magnetic properties make it easy to recover from waste streams, and nearly 100% of the steel industry’s co-products can be used in other manufacturing or electricity generation.
It’s fitting then that steel makes up essential parts of various sustainable energy technologies:
- The average wind turbine is made of 80% steel on average (140 metric tons).
- Steel is used in the base, pumps, tanks, and heat exchangers of solar power installations.
- Electrical steel is at the heart of the generators and motors of electric and hybrid vehicles.
The Steel Industry’s Future Sustainability
Considering the crucial role steel plays in just about every industry, it’s no wonder that prices are surging to record highs. However, steel producers are thinking about long-term sustainability, and are working to make fossil-fuel-free steel a reality by completely removing coal from the metallurgical process.
While the industry has already cut down the average energy intensity per metric ton produced from 50 gigajoules to 20 gigajoules since the 1960s, steel-producing giants like ArcelorMittal are going further and laying out their plans for carbon-neutral steel production by 2050.
Steel consumption and demand is only set to continue rising as the world’s economy gradually reopens, especially as Rio Tinto’s new development of atomized steel powder could bring about the next evolution in 3D printing.
As the industry continues to innovate in both sustainability and usability, steel will continue to be a vital material across industries that we can infinitely recycle and rely on.


Mining
Visualizing Global Gold Production in 2023
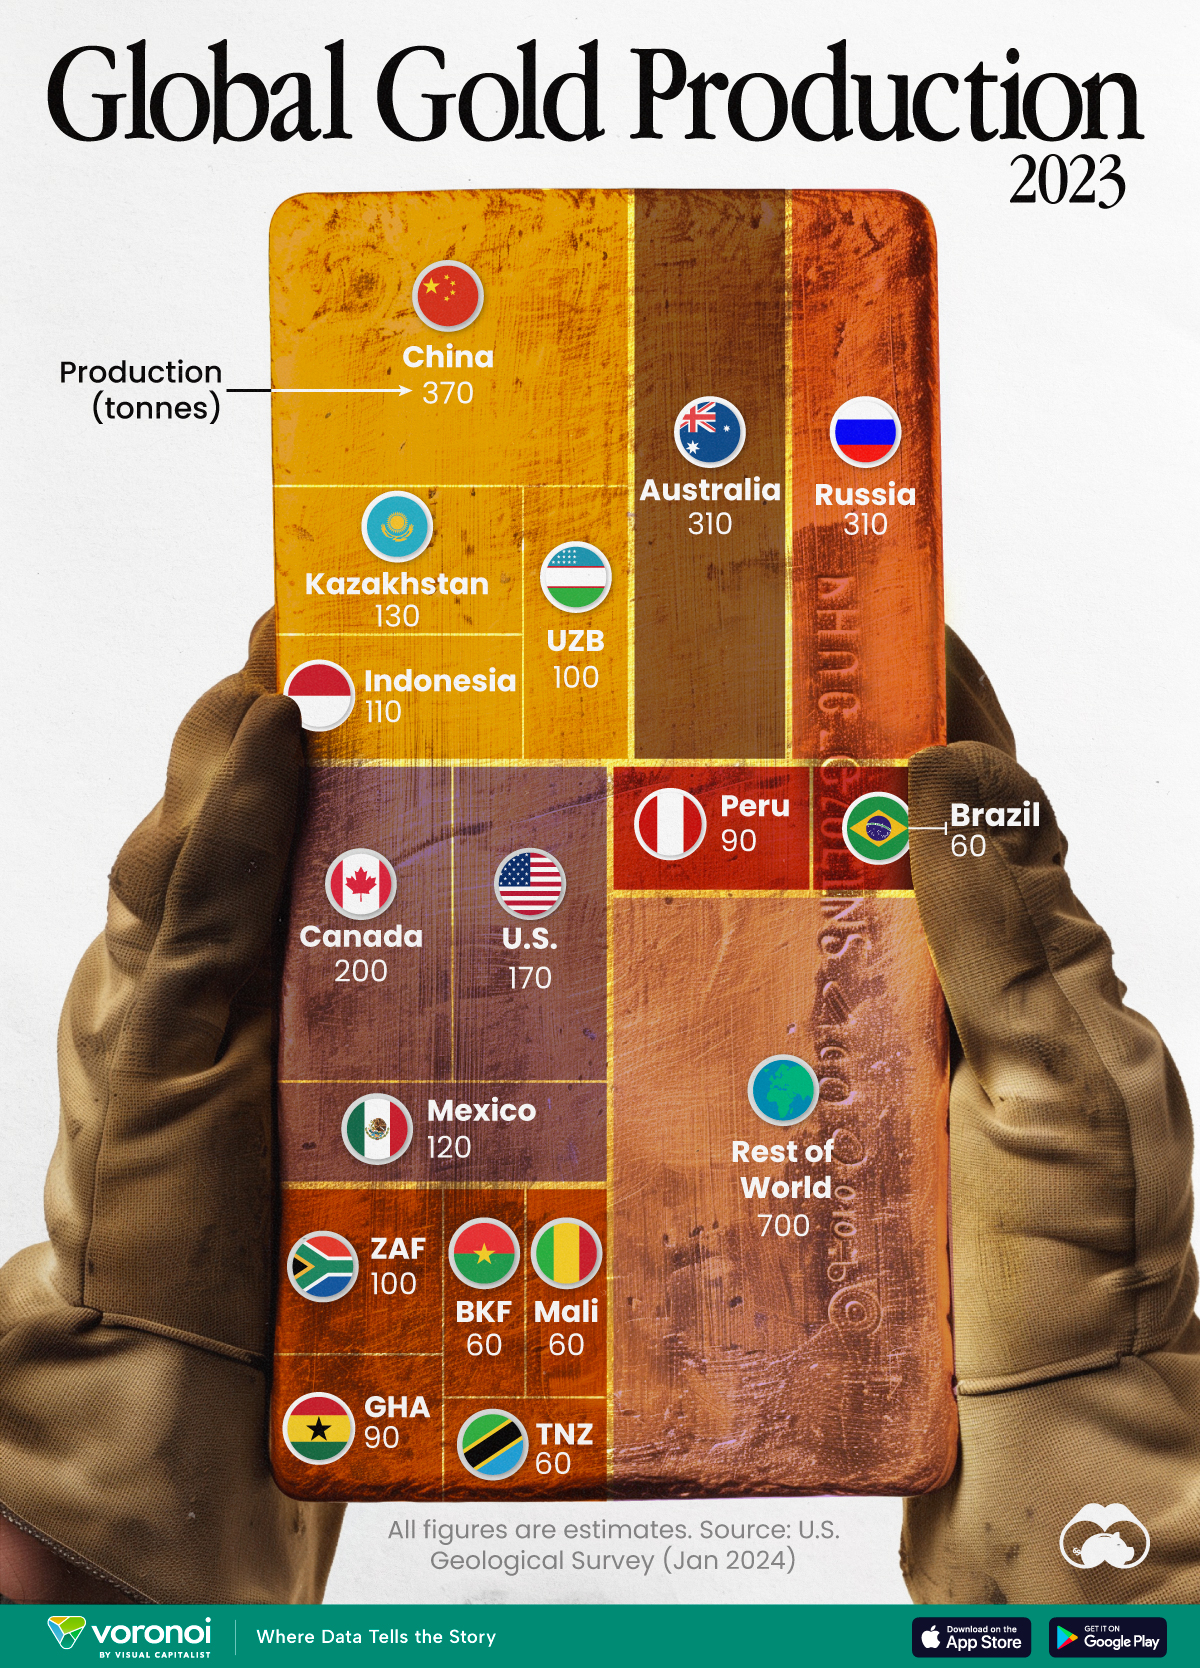
Gold production in 2023 was led by China, Australia, and Russia, with each outputting over 300 tonnes.
Visualizing Global Gold Production in 2023
This was originally posted on our Voronoi app. Download the app for free on iOS or Android and discover incredible data-driven charts from a variety of trusted sources.
Over 3,000 tonnes of gold were produced globally in 2023.
In this graphic, we list the world’s leading countries in terms of gold production. These figures come from the latest USGS publication on gold statistics (published January 2024).
China, Australia, and Russia Produced the Most Gold in 2023
China was the top producer in 2023, responsible for over 12% of total global production, followed by Australia and Russia.
| Country | Region | 2023E Production (tonnes) |
|---|---|---|
| 🇨🇳 China | Asia | 370 |
| 🇦🇺 Australia | Oceania | 310 |
| 🇷🇺 Russia | Europe | 310 |
| 🇨🇦 Canada | North America | 200 |
| 🇺🇸 United States | North America | 170 |
| 🇰🇿 Kazakhstan | Asia | 130 |
| 🇲🇽 Mexico | North America | 120 |
| 🇮🇩 Indonesia | Asia | 110 |
| 🇿🇦 South Africa | Africa | 100 |
| 🇺🇿 Uzbekistan | Asia | 100 |
| 🇬🇭 Ghana | Africa | 90 |
| 🇵🇪 Peru | South America | 90 |
| 🇧🇷 Brazil | South America | 60 |
| 🇧🇫 Burkina Faso | Africa | 60 |
| 🇲🇱 Mali | Africa | 60 |
| 🇹🇿 Tanzania | Africa | 60 |
| 🌍 Rest of World | - | 700 |
Gold mines in China are primarily concentrated in eastern provinces such as Shandong, Henan, Fujian, and Liaoning. As of January 2024, China’s gold mine reserves stand at an estimated 3,000 tonnes, representing around 5% of the global total of 59,000 tonnes.
In addition to being the top producer, China emerged as the largest buyer of the yellow metal for the year. In fact, the country’s central bank alone bought 225 tonnes of gold in 2023, according the World Gold Council.
Estimated Global Gold Consumption
Most of the gold produced in 2023 was used in jewelry production, while another significant portion was sold as a store of value, such as in gold bars or coins.
- Jewelry: 46%
- Central Banks and Institutions: 23%
- Physical Bars: 16%
- Official Coins, Medals, and Imitation Coins: 9%
- Electrical and Electronics: 5%
- Other: 1%
According to Fitch Solutions, over the medium term (2023-2032), global gold mine production is expected to grow 15%, as high prices encourage investment and output.

-

 Technology7 days ago
All of the Grants Given by the U.S. CHIPS Act
-

 Education2 weeks ago
How Hard Is It to Get Into an Ivy League School?
-

 Debt2 weeks ago
How Debt-to-GDP Ratios Have Changed Since 2000
-

 Sports2 weeks ago
The Highest Earning Athletes in Seven Professional Sports
-

 Science2 weeks ago
Visualizing the Average Lifespans of Mammals
-

 Brands1 week ago
How Tech Logos Have Evolved Over Time
-

 Energy1 week ago
Ranked: The Top 10 EV Battery Manufacturers in 2023
-

 Demographics1 week ago
Countries With the Largest Happiness Gains Since 2010