Mining
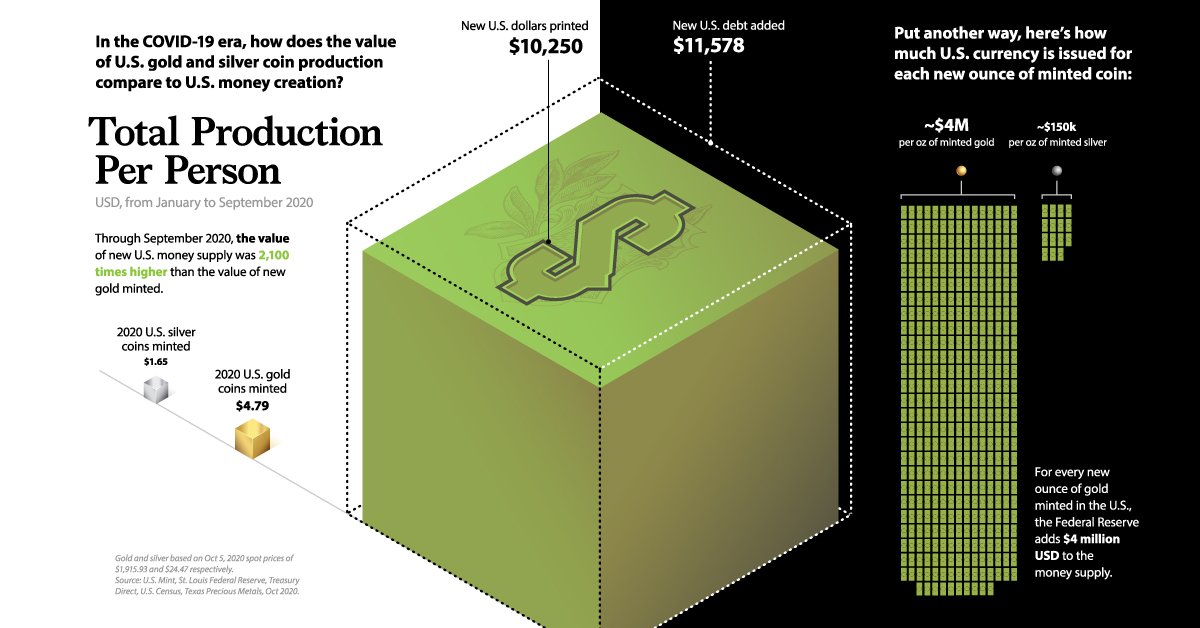
Visualizing U.S. Money Supply vs. Precious Metal Production in the COVID-19 Era
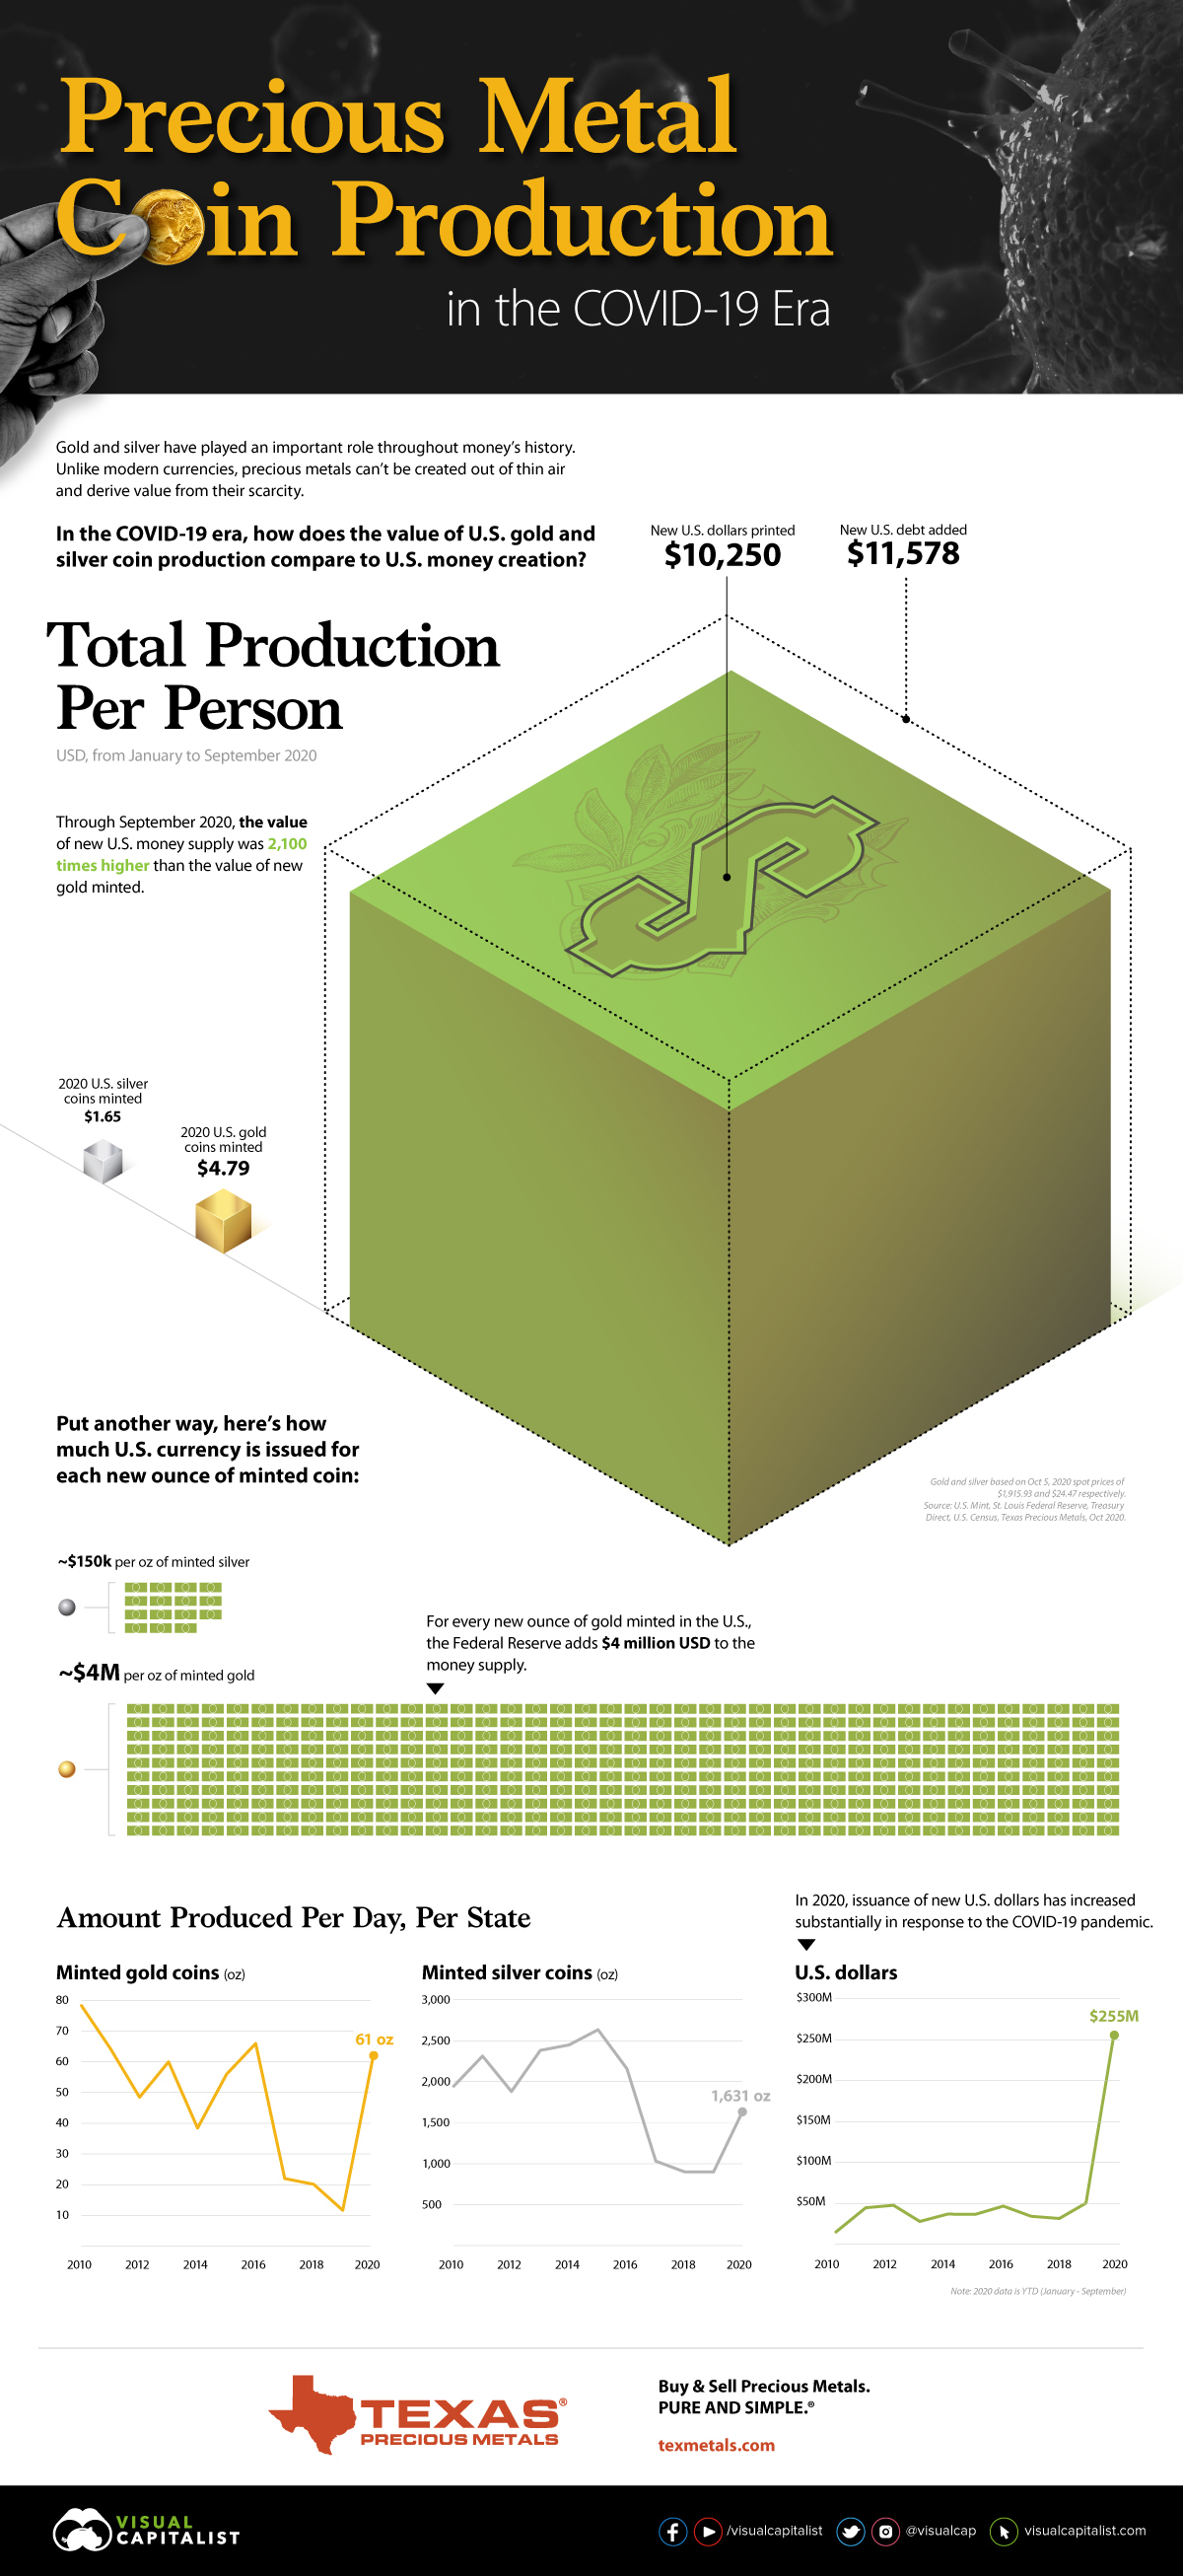
U.S. Precious Metal Coin Production in the COVID-19 Era
Gold and silver have played an important role in money throughout history. Unlike modern currencies, they can’t be created out of thin air and derive value from their scarcity.
In the COVID-19 era, this difference has become more prominent as countries print vast amounts of currency to support their suffering economies. This graphic from Texas Precious Metals highlights how the value of U.S. precious metal coin production compares to U.S. money creation.
Year to Date Production
In this infographic, we have calculated the value of money supply added as well as bullion minted, and divided it by the U.S. population to get total production per person. Here’s how the January-September 2020 data breaks down:
| Total (Ounces) | Dollar Value | Dollar Value Per Person | |
|---|---|---|---|
| U.S. Gold Ounces | 826,000 | $1.6B | $4.79 |
| U.S. Silver Ounces | 22,261,500 | $544M | $1.65 |
| U.S. Money Supply | $3.4T | $10,250.16 | |
| U.S. Debt | $3.8T | $11,578.36 |
Gold and silver dollar values based on Oct 5, 2020 spot prices of $1,915.93 and $24.47 respectively.
The value of new U.S. money supply was more than 2,100 times higher than the value of new gold minted. Compared to minted silver, the value of new U.S. money supply was over 6,000 times higher.
Production Per Day, Per State Over Time
Here’s how production has changed on a per day, per state basis since 2010:
| 2010 | 2020 YTD (Jan-Sep) | Min-Max Production, 2010-2019 | |
|---|---|---|---|
| Minted Gold Coins | 78oz | 61oz | 12oz-78oz |
| Minted Silver Coins | 1,945oz | 1,631oz | 899oz-2,633oz |
| U.S. Dollars | $19M | $255M | $19M-$50M |
Year to date, U.S. precious metal coin production is within a normal historical range. If production were to continue at the current rate through December, gold would be above historical norms at 81 ounces and silver would be within the normal range at 2,175 ounces.
The issuance of U.S. dollars tells a different story. Over the last nine months, the U.S. has already added 400% more dollars to its money supply than it did in the entirety of 2019—and there’s still three months left to go in the year.
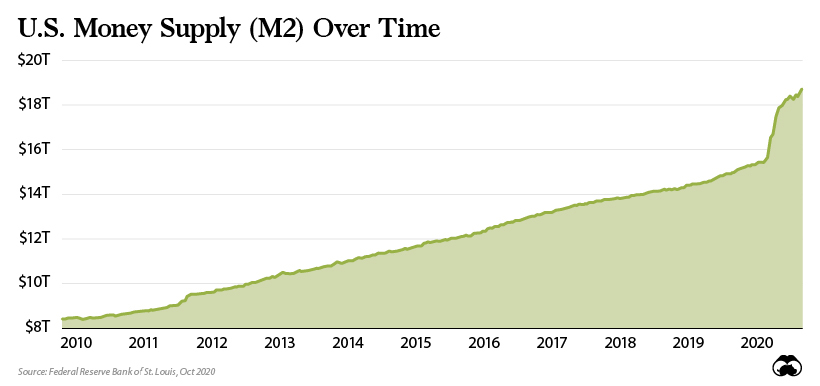
A Macroeconomic View
Of course, current economic conditions have been a catalyst for the ballooning money supply. In response to the COVID-19 pandemic, the U.S. government has issued over $3 trillion in fiscal stimulus. In turn, the U.S. Federal Reserve has increased the money supply by $3.4 trillion from January to September 2020.
Put another way, for every ounce of gold created in 2020 there has been $4 million U.S. dollars added to the money supply.
The question for those looking for safe haven investments is: which of these will ultimately hold their value better?


Mining
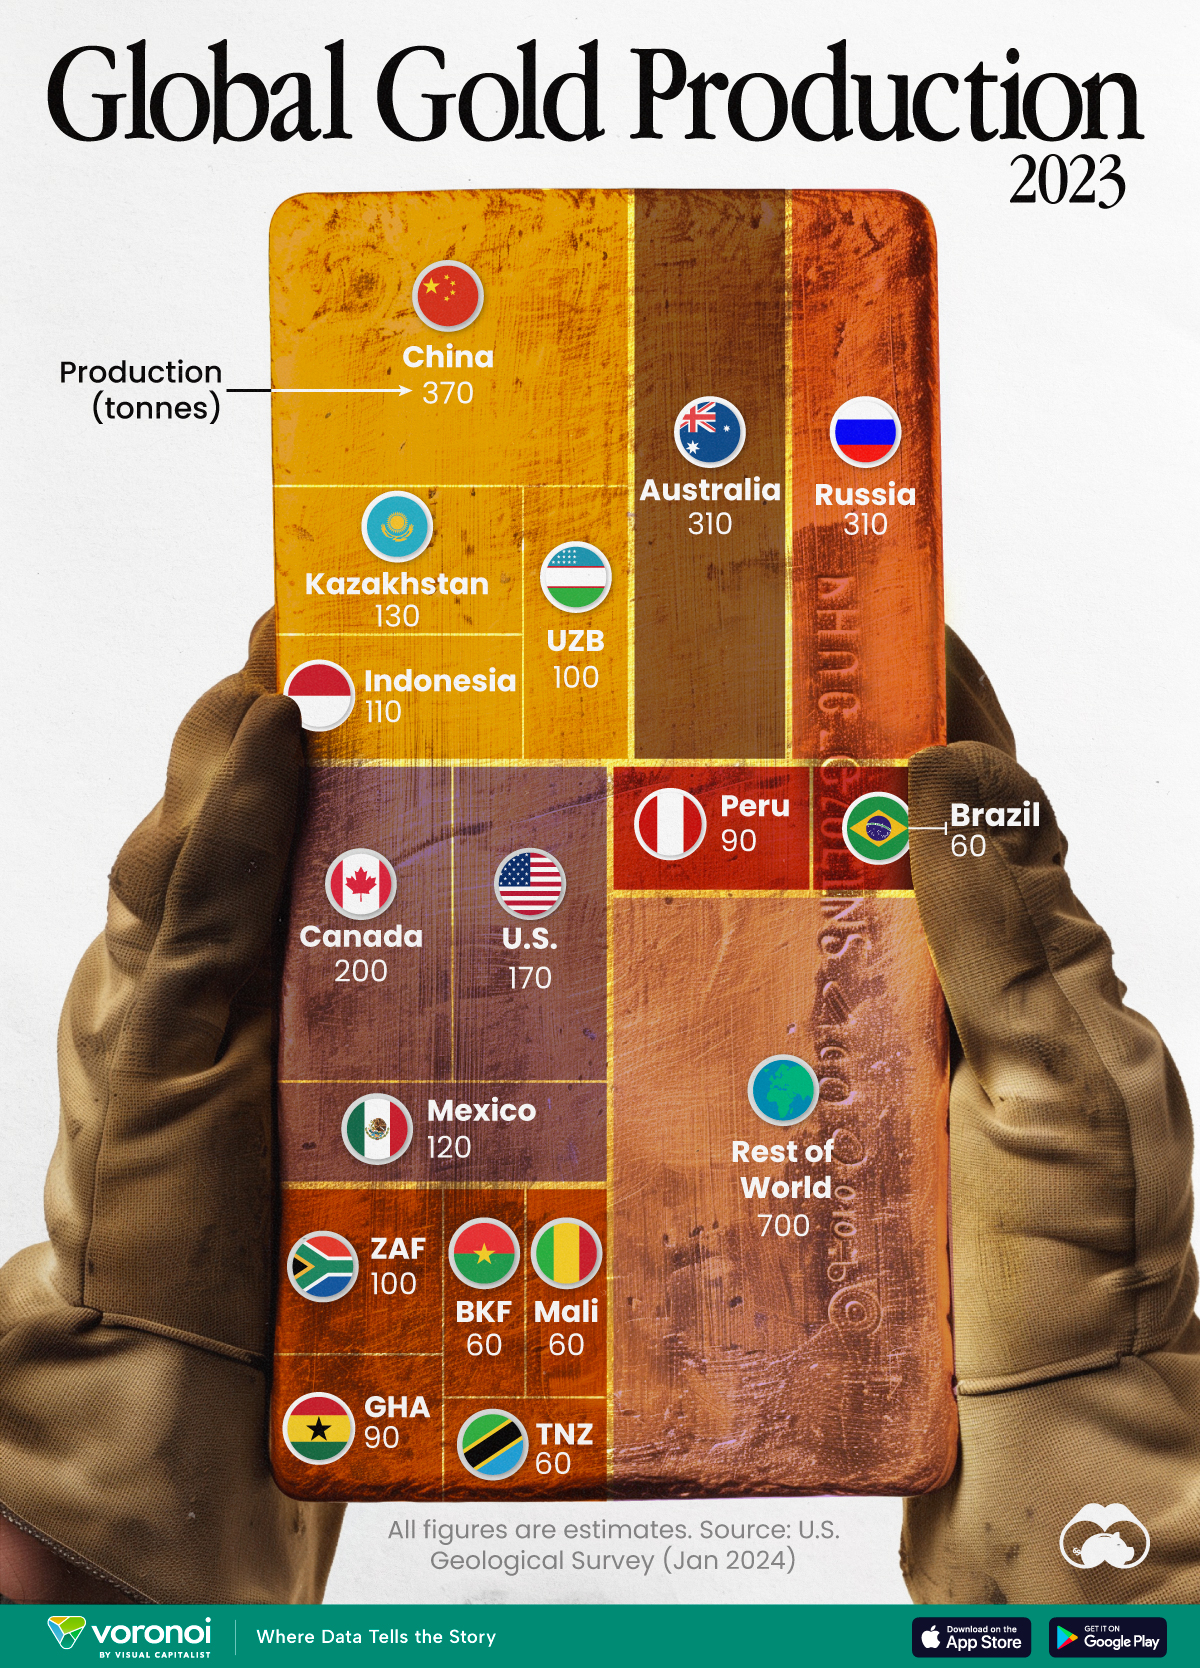
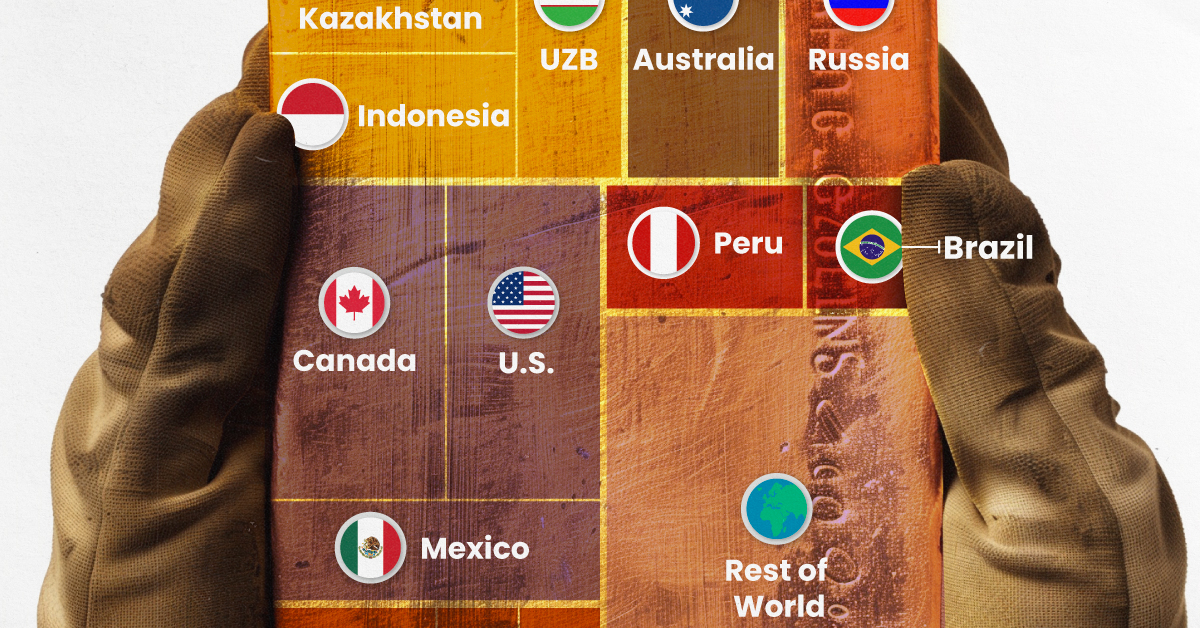
Visualizing Global Gold Production in 2023
Gold production in 2023 was led by China, Australia, and Russia, with each outputting over 300 tonnes.
Visualizing Global Gold Production in 2023
This was originally posted on our Voronoi app. Download the app for free on iOS or Android and discover incredible data-driven charts from a variety of trusted sources.
Over 3,000 tonnes of gold were produced globally in 2023.
In this graphic, we list the world’s leading countries in terms of gold production. These figures come from the latest USGS publication on gold statistics (published January 2024).
China, Australia, and Russia Produced the Most Gold in 2023
China was the top producer in 2023, responsible for over 12% of total global production, followed by Australia and Russia.
| Country | Region | 2023E Production (tonnes) |
|---|---|---|
| 🇨🇳 China | Asia | 370 |
| 🇦🇺 Australia | Oceania | 310 |
| 🇷🇺 Russia | Europe | 310 |
| 🇨🇦 Canada | North America | 200 |
| 🇺🇸 United States | North America | 170 |
| 🇰🇿 Kazakhstan | Asia | 130 |
| 🇲🇽 Mexico | North America | 120 |
| 🇮🇩 Indonesia | Asia | 110 |
| 🇿🇦 South Africa | Africa | 100 |
| 🇺🇿 Uzbekistan | Asia | 100 |
| 🇬🇭 Ghana | Africa | 90 |
| 🇵🇪 Peru | South America | 90 |
| 🇧🇷 Brazil | South America | 60 |
| 🇧🇫 Burkina Faso | Africa | 60 |
| 🇲🇱 Mali | Africa | 60 |
| 🇹🇿 Tanzania | Africa | 60 |
| 🌍 Rest of World | - | 700 |
Gold mines in China are primarily concentrated in eastern provinces such as Shandong, Henan, Fujian, and Liaoning. As of January 2024, China’s gold mine reserves stand at an estimated 3,000 tonnes, representing around 5% of the global total of 59,000 tonnes.
In addition to being the top producer, China emerged as the largest buyer of the yellow metal for the year. In fact, the country’s central bank alone bought 225 tonnes of gold in 2023, according the World Gold Council.
Estimated Global Gold Consumption
Most of the gold produced in 2023 was used in jewelry production, while another significant portion was sold as a store of value, such as in gold bars or coins.
- Jewelry: 46%
- Central Banks and Institutions: 23%
- Physical Bars: 16%
- Official Coins, Medals, and Imitation Coins: 9%
- Electrical and Electronics: 5%
- Other: 1%
According to Fitch Solutions, over the medium term (2023-2032), global gold mine production is expected to grow 15%, as high prices encourage investment and output.

-

 Markets6 days ago
Visualized: Interest Rate Forecasts for Advanced Economies
-

 Markets2 weeks ago
Economic Growth Forecasts for G7 and BRICS Countries in 2024
-

 Wealth2 weeks ago
Charted: Which City Has the Most Billionaires in 2024?
-

 Technology2 weeks ago
All of the Grants Given by the U.S. CHIPS Act
-

 Green2 weeks ago
The Carbon Footprint of Major Travel Methods
-

 United States1 week ago
Visualizing the Most Common Pets in the U.S.
-

 Culture1 week ago
The World’s Top Media Franchises by All-Time Revenue
-

 voronoi1 week ago
Best Visualizations of April on the Voronoi App