Technology
Ranked: The Top 100 Product Searches on Amazon


What Products are People Searching for on Amazon?
When it comes to searching for products online, a majority of U.S. shoppers go directly to Amazon. Thanks to this widespread use, product searches on Amazon provide interesting insights into current consumer behavior, including what shoppers have been focusing on in 2020.
Today’s chart uses data from Ahrefs to showcase Amazon’s top 100 U.S. product searches. We’ll also dive into the most popular categories, as well as top keyword searches on a global basis.
Top 100 Amazon Product Searches in the U.S.
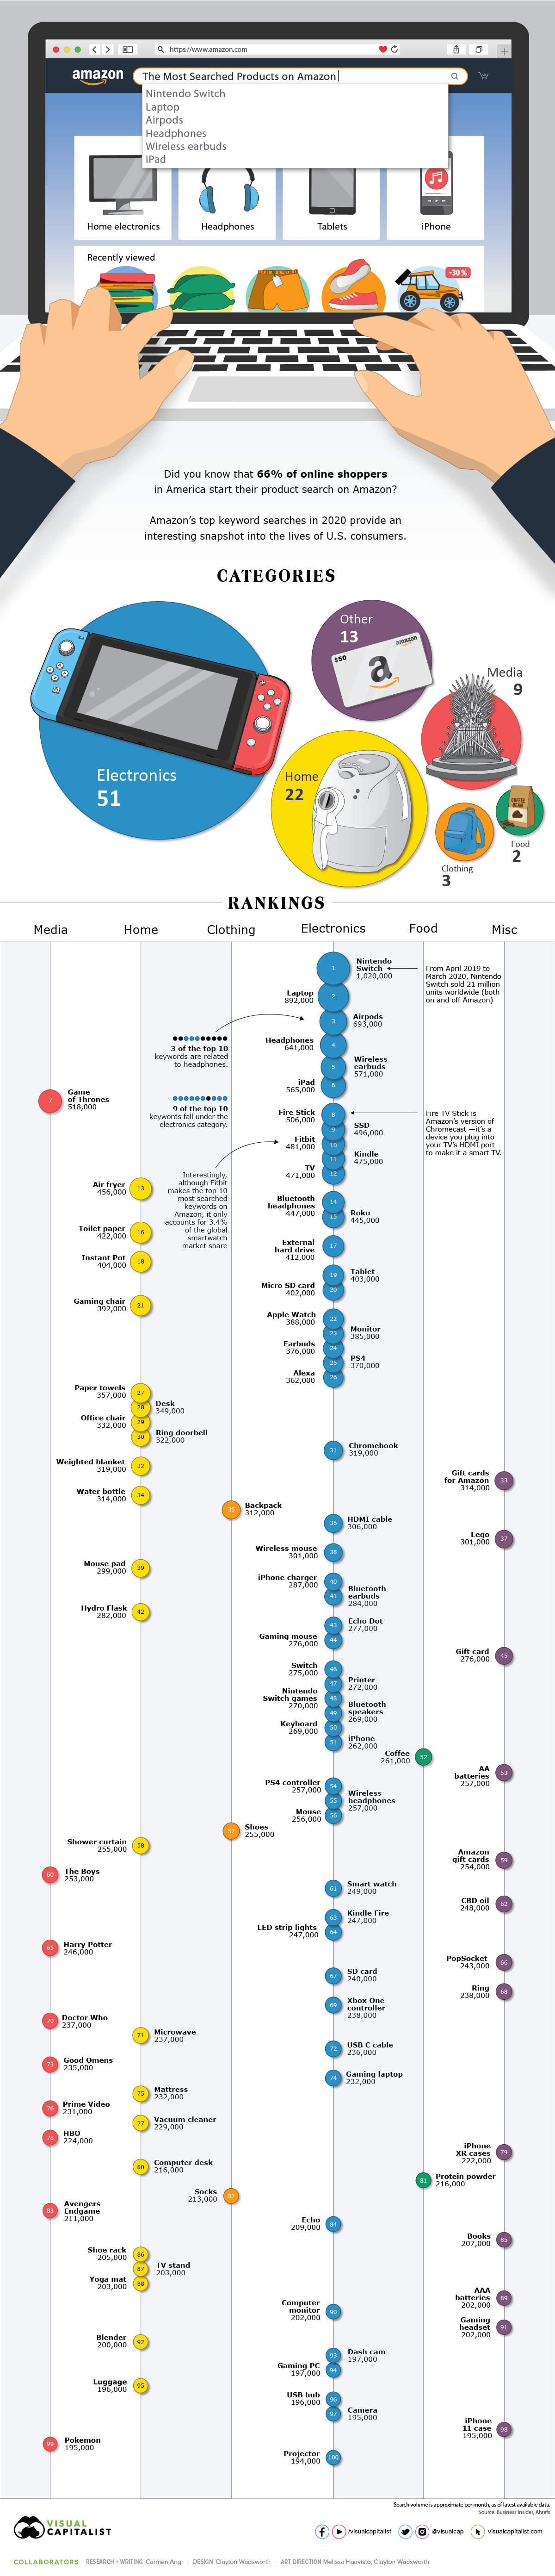
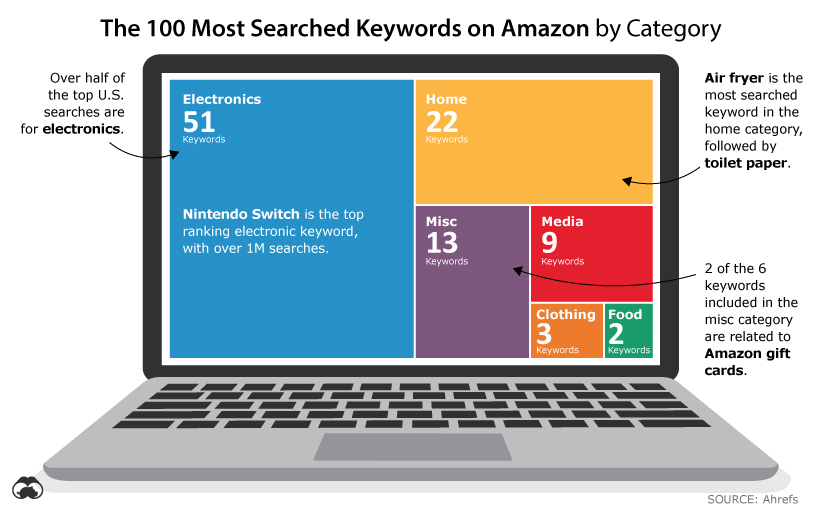
Out of the top 100 product searches on Amazon, over half are for electronics.
Nintendo Switch is the most searched product keyword, with approximately one million monthly searches. This makes sense, considering the console’s recent surge in popularity—in March 2020, U.S. sales of the Nintendo Switch more than doubled compared to a year prior.
Here’s a look at the full ranking of all product keywords, by monthly search volume:
| Rank | Keyword | Search Volume | Category |
|---|---|---|---|
| 1 | nintendo switch | 1,020,000 | Electronics |
| 2 | laptop | 892,000 | Electronics |
| 3 | airpods | 693,000 | Electronics |
| 4 | headphones | 641,000 | Electronics |
| 5 | wireless earbuds | 571,000 | Electronics |
| 6 | ipad | 565,000 | Electronics |
| 7 | game of thrones | 518,000 | Media |
| 8 | fire stick | 506,000 | Electronics |
| 9 | ssd | 496,000 | Electronics |
| 10 | fitbit | 481,000 | Electronics |
| 11 | kindle | 475,000 | Electronics |
| 12 | tv | 471,000 | Electronics |
| 13 | air fryer | 456,000 | Home |
| 14 | bluetooth headphones | 447,000 | Electronics |
| 15 | roku | 445,000 | Electronics |
| 16 | toilet paper | 422,000 | Home |
| 17 | external hard drive | 412,000 | Electronics |
| 18 | instant pot | 404,000 | Home |
| 19 | tablet | 403,000 | Electronics |
| 20 | micro sd card | 402,000 | Electronics |
| 21 | gaming chair | 392,000 | Home |
| 22 | apple watch | 388,000 | Electronics |
| 23 | monitor | 385,000 | Electronics |
| 24 | earbuds | 376,000 | Electronics |
| 25 | ps4 | 370,000 | Electronics |
| 26 | alexa | 362,000 | Electronics |
| 27 | paper towels | 357,000 | Home |
| 28 | desk | 349,000 | Home |
| 29 | office chair | 332,000 | Home |
| 30 | ring doorbell | 322,000 | Home |
| 31 | chromebook | 319,000 | Electronics |
| 32 | weighted blanket | 319,000 | Home |
| 33 | gift cards for amazon | 314,000 | Misc |
| 34 | water bottle | 314,000 | Home |
| 35 | backpack | 312,000 | Clothing |
| 36 | hdmi cable | 306,000 | Electronics |
| 37 | lego | 301,000 | Misc |
| 38 | wireless mouse | 301,000 | Electronics |
| 39 | mouse pad | 299,000 | Home |
| 40 | iphone charger | 287,000 | Electronics |
| 41 | bluetooth earbuds | 284,000 | Electronics |
| 42 | hydro flask | 282,000 | Home |
| 43 | echo dot | 277,000 | Electronics |
| 44 | gaming mouse | 276,000 | Electronics |
| 45 | gift card | 276,000 | Misc |
| 46 | switch | 275,000 | Electronics |
| 47 | printer | 272,000 | Electronics |
| 48 | nintendo switch games | 270,000 | Electronics |
| 49 | bluetooth speakers | 269,000 | Electronics |
| 50 | keyboard | 269,000 | Electronics |
| 51 | iphone | 262,000 | Electronics |
| 52 | coffee | 261,000 | Food |
| 53 | aa batteries | 257,000 | Misc |
| 54 | ps4 controller | 257,000 | Electronics |
| 55 | wireless headphones | 257,000 | Electronics |
| 56 | mouse | 256,000 | Electronics |
| 57 | shoes | 255,000 | Clothing |
| 58 | shower curtain | 255,000 | Home |
| 59 | amazon gift cards | 254,000 | Misc |
| 60 | the boys | 253,000 | Media |
| 61 | smart watch | 249,000 | Electronics |
| 62 | cbd oil | 248,000 | Misc |
| 63 | kindle fire | 247,000 | Electronics |
| 64 | led strip lights | 247,000 | Electronics |
| 65 | harry potter | 246,000 | Media |
| 66 | pop socket | 243,000 | Misc |
| 67 | sd card | 240,000 | Electronics |
| 68 | ring | 238,000 | Misc |
| 69 | xbox one controller | 238,000 | Electronics |
| 70 | doctor who | 237,000 | Media |
| 71 | microwave | 237,000 | Home |
| 72 | usb c cable | 236,000 | Electronics |
| 73 | good omens | 235,000 | Media |
| 74 | gaming laptop | 232,000 | Electronics |
| 75 | mattress | 232,000 | Home |
| 76 | prime video | 231,000 | Media |
| 77 | vacuum cleaner | 229,000 | Home |
| 78 | hbo | 224,000 | Media |
| 79 | iphone xr cases | 222,000 | Misc |
| 80 | computer desk | 216,000 | Home |
| 81 | protein powder | 216,000 | Food |
| 82 | socks | 213,000 | Clothing |
| 83 | avengers endgame | 211,000 | Media |
| 84 | echo | 209,000 | Electronics |
| 85 | books | 207,000 | Misc |
| 86 | shoe rack | 205,000 | Home |
| 87 | tv stand | 203,000 | Home |
| 88 | yoga mat | 203,000 | Home |
| 89 | aaa batteries | 202,000 | Misc |
| 90 | computer monitor | 202,000 | Electronics |
| 91 | gaming headset | 202,000 | Misc |
| 92 | blender | 200,000 | Home |
| 93 | dash cam | 197,000 | Electronics |
| 94 | gaming pc | 197,000 | Electronics |
| 95 | luggage | 196,000 | Home |
| 96 | usb hub | 196,000 | Electronics |
| 97 | camera | 195,000 | Electronics |
| 98 | iphone 11 case | 195,000 | Misc |
| 99 | pokemon | 195,000 | Media |
| 100 | projector | 194,000 | Electronics |
Two different Apple products make the top 10—Airpods and iPad. It’s interesting that Airpods and iPads have their own search term distinctive from their broader categories (wireless headphones and tablets), demonstrating Apple’s strong brand recognition in America.
Of course, Apple is also dominant in the personal tech market more broadly. For instance, iPhones make up 46% of the U.S. smartphone market by number of devices sold.
Top 100 Amazon Product Searches Globally
Like the U.S. top searches, Nintendo Switch comes in at number one worldwide, with over 2 million approximate monthly searches.
| Rank | Keyword | Search Volume | Category |
|---|---|---|---|
| 1 | nintendo switch | 2,520,000 | Electronics |
| 2 | laptop | 1,990,000 | Electronics |
| 3 | ssd | 1,780,000 | Electronics |
| 4 | kindle | 1,420,000 | Electronics |
| 5 | ps4 | 1,420,000 | Electronics |
| 6 | airpods | 1,350,000 | Electronics |
| 7 | ipad | 1,290,000 | Electronics |
| 8 | tablet | 1,150,000 | Electronics |
| 9 | iphone | 1,140,000 | Electronics |
| 10 | alexa | 1,120,000 | Electronics |
| 11 | headphones | 1,110,000 | Electronics |
| 12 | game of thrones | 1,040,000 | Media |
| 13 | lego | 1,020,000 | Misc |
| 14 | switch | 955,000 | Electronics |
| 15 | fitbit | 910,000 | Electronics |
| 16 | tv | 905,000 | Electronics |
| 17 | harry potter | 859,000 | Media |
| 18 | xiaomi | 836,000 | Electronics |
| 19 | monitor | 795,000 | Electronics |
| 20 | apple watch | 703,000 | Electronics |
| 21 | iphone 7 | 691,000 | Electronics |
| 22 | wireless earbuds | 687,000 | Electronics |
| 23 | iphone x | 670,000 | Electronics |
| 24 | fire stick | 664,000 | Electronics |
| 25 | bluetooth headphones | 655,000 | Electronics |
| 26 | samsung | 611,000 | Electronics |
| 27 | iphone 8 | 606,000 | Electronics |
| 28 | iphone xr | 606,000 | Electronics |
| 29 | mouse | 577,000 | Electronics |
| 30 | micro sd card | 576,000 | Electronics |
| 31 | gaming chair | 574,000 | Home |
| 32 | air fryer | 567,000 | Home |
| 33 | echo dot | 560,000 | Electronics |
| 34 | smart watch | 547,000 | Electronics |
| 35 | smartphone | 545,000 | Electronics |
| 36 | external hard drive | 526,000 | Electronics |
| 37 | instant pot | 516,000 | Home |
| 38 | roku | 514,000 | Electronics |
| 39 | star wars | 512,000 | Media |
| 40 | ps4 controller | 508,000 | Electronics |
| 41 | water bottle | 507,000 | Home |
| 42 | keyboard | 499,000 | Electronics |
| 43 | chromebook | 491,000 | Electronics |
| 44 | huawei | 490,000 | Electronics |
| 45 | gaming mouse | 484,000 | Electronics |
| 46 | pokemon | 483,000 | Media |
| 47 | shoes | 479,000 | Clothing |
| 48 | backpack | 473,000 | Clothing |
| 49 | playstation 4 | 472,000 | Electronics |
| 50 | earbuds | 471,000 | Electronics |
| 51 | echo | 467,000 | Electronics |
| 52 | toilet paper | 467,000 | Home |
| 53 | smartwatch | 461,000 | Electronics |
| 54 | notebook | 459,000 | Electronics |
| 55 | iphone 11 | 454,000 | Electronics |
| 56 | power bank | 454,000 | Electronics |
| 57 | xbox one | 452,000 | Electronics |
| 58 | wireless mouse | 450,000 | Electronics |
| 59 | gaming pc | 449,000 | Electronics |
| 60 | desk | 443,000 | Home |
| 61 | office chair | 442,000 | Home |
| 62 | mouse pad | 439,000 | Home |
| 63 | redmi note 7 | 433,000 | Electronics |
| 64 | printer | 431,000 | Electronics |
| 65 | chromecast | 430,000 | Electronics |
| 66 | gaming laptop | 429,000 | Electronics |
| 67 | hdmi cable | 422,000 | Electronics |
| 68 | earphones | 421,000 | Electronics |
| 69 | wireless headphones | 420,000 | Electronics |
| 70 | drone | 415,000 | Electronics |
| 71 | books | 408,000 | Misc |
| 72 | funko pop | 406,000 | Misc |
| 73 | nintendo switch games | 402,000 | Electronics |
| 74 | amazon | 400,000 | Misc |
| 75 | camera | 398,000 | Electronics |
| 76 | gift card | 396,000 | Misc |
| 77 | sd card | 396,000 | Electronics |
| 78 | xbox one controller | 392,000 | Electronics |
| 79 | ps4 games | 388,000 | Electronics |
| 80 | rtx 2060 | 387,000 | Electronics |
| 81 | laptops | 385,000 | Electronics |
| 82 | ring doorbell | 383,000 | Home |
| 83 | ipad pro | 381,000 | Electronics |
| 84 | ps4 pro | 378,000 | Electronics |
| 85 | gopro | 375,000 | Electronics |
| 86 | the boys | 375,000 | Media |
| 87 | bluetooth earbuds | 369,000 | Electronics |
| 88 | weighted blanket | 368,000 | Home |
| 89 | windows 10 | 368,000 | Electronics |
| 90 | paper towels | 367,000 | Home |
| 91 | avengers endgame | 366,000 | Media |
| 92 | lego star wars | 362,000 | Misc |
| 93 | xiaomi redmi note 7 | 362,000 | Electronics |
| 94 | microwave | 361,000 | Home |
| 95 | bluetooth speakers | 360,000 | Electronics |
| 96 | good omens | 357,000 | Media |
| 97 | coffee | 356,000 | Food |
| 98 | nike | 356,000 | Clothing |
| 99 | projector | 355,000 | Electronics |
| 100 | vans | 355,000 | Clothing |
Interestingly, three different Apple products appear in the top 10 global searches—Airpods, iPad, and iPhone. Additionally, a couple of older iPhone models make the overall ranking—iPhone 7 comes in at 21st place, and iPhone 8 takes the 28th spot.
On the U.S. list, these older iPhone models don’t even make the top 100.
Keyword Category Rankings
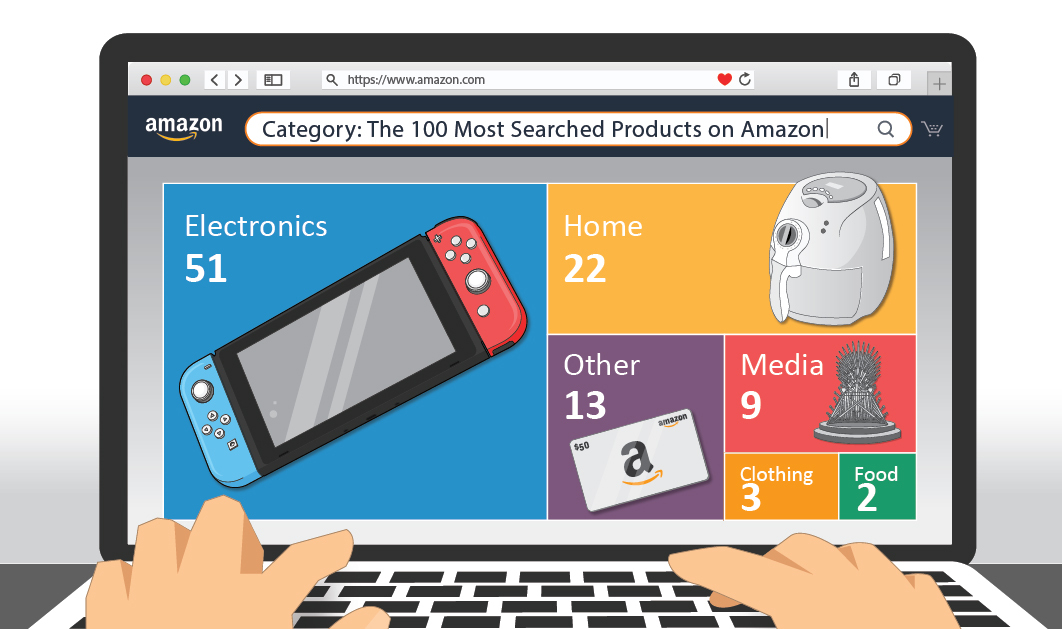
When it comes to top-ranking keywords, the electronics category appears to be the most important to Americans. Over half the U.S. top product searches fall under electronics, with the home category in second place.
Here’s a look at the full U.S. category breakdown:
Interestingly, when comparing the order of categories in the U.S versus worldwide, the sections remain mostly the same:
| Category | # of U.S. Keywords | # of Global Keywords |
|---|---|---|
| Electronics | 51 | 70 |
| Home | 22 | 12 |
| Media | 9 | 7 |
| Misc | 13 | 6 |
| Clothing | 3 | 4 |
| Food | 2 | 1 |
Like the U.S., electronics comes in at number one worldwide. However, it’s an even larger portion for the global ranking—70 keyword searches on the global list are for electronics.
The home category is more popular in the U.S. than across the globe, with 22 in the U.S. versus 12 worldwide. In America, air fryer is the most popular keyword search under this section—possibly because people were looking for a quick way to make their meals while they were busy playing Animal Crossing on their Switches.
The second most popular U.S. keyword under the home category is toilet paper. Considering the toilet paper shortages in the spring of 2020, this makes sense, as stores began limiting the number of rolls a person could purchase.
What Will 2021 Bring?
Based on the top 100 list, both globally and in the U.S., it’s clear that when searching on Amazon, a majority of consumers are looking for electronics.
However, the specific electronics they’re searching for (such as iPhones and Nintendo Switches), helps to provide some context around the products people are interested in, as well as the particular brands that are currently on everyone’s radar.
Will the Switch get switched out of the top spot in 2021? Because electronics tend to update so frequently, it’s very possible.


Technology
Visualizing AI Patents by Country
See which countries have been granted the most AI patents each year, from 2012 to 2022.


Visualizing AI Patents by Country
This was originally posted on our Voronoi app. Download the app for free on iOS or Android and discover incredible data-driven charts from a variety of trusted sources.
This infographic shows the number of AI-related patents granted each year from 2010 to 2022 (latest data available). These figures come from the Center for Security and Emerging Technology (CSET), accessed via Stanford University’s 2024 AI Index Report.
From this data, we can see that China first overtook the U.S. in 2013. Since then, the country has seen enormous growth in the number of AI patents granted each year.
| Year | China | EU and UK | U.S. | RoW | Global Total |
|---|---|---|---|---|---|
| 2010 | 307 | 137 | 984 | 571 | 1,999 |
| 2011 | 516 | 129 | 980 | 581 | 2,206 |
| 2012 | 926 | 112 | 950 | 660 | 2,648 |
| 2013 | 1,035 | 91 | 970 | 627 | 2,723 |
| 2014 | 1,278 | 97 | 1,078 | 667 | 3,120 |
| 2015 | 1,721 | 110 | 1,135 | 539 | 3,505 |
| 2016 | 1,621 | 128 | 1,298 | 714 | 3,761 |
| 2017 | 2,428 | 144 | 1,489 | 1,075 | 5,136 |
| 2018 | 4,741 | 155 | 1,674 | 1,574 | 8,144 |
| 2019 | 9,530 | 322 | 3,211 | 2,720 | 15,783 |
| 2020 | 13,071 | 406 | 5,441 | 4,455 | 23,373 |
| 2021 | 21,907 | 623 | 8,219 | 7,519 | 38,268 |
| 2022 | 35,315 | 1,173 | 12,077 | 13,699 | 62,264 |
In 2022, China was granted more patents than every other country combined.
While this suggests that the country is very active in researching the field of artificial intelligence, it doesn’t necessarily mean that China is the farthest in terms of capability.
Key Facts About AI Patents
According to CSET, AI patents relate to mathematical relationships and algorithms, which are considered abstract ideas under patent law. They can also have different meaning, depending on where they are filed.
In the U.S., AI patenting is concentrated amongst large companies including IBM, Microsoft, and Google. On the other hand, AI patenting in China is more distributed across government organizations, universities, and tech firms (e.g. Tencent).
In terms of focus area, China’s patents are typically related to computer vision, a field of AI that enables computers and systems to interpret visual data and inputs. Meanwhile America’s efforts are more evenly distributed across research fields.
Learn More About AI From Visual Capitalist
If you want to see more data visualizations on artificial intelligence, check out this graphic that shows which job departments will be impacted by AI the most.

-

 Mining1 week ago
Gold vs. S&P 500: Which Has Grown More Over Five Years?
-

 Markets2 weeks ago
Ranked: The Most Valuable Housing Markets in America
-

 Money2 weeks ago
Which States Have the Highest Minimum Wage in America?
-

 AI2 weeks ago
Ranked: Semiconductor Companies by Industry Revenue Share
-

 Markets2 weeks ago
Ranked: The World’s Top Flight Routes, by Revenue
-

 Countries2 weeks ago
Population Projections: The World’s 6 Largest Countries in 2075
-

 Markets2 weeks ago
The Top 10 States by Real GDP Growth in 2023
-

 Demographics2 weeks ago
The Smallest Gender Wage Gaps in OECD Countries