Energy
The World’s 10 Biggest Oil and Gas Companies
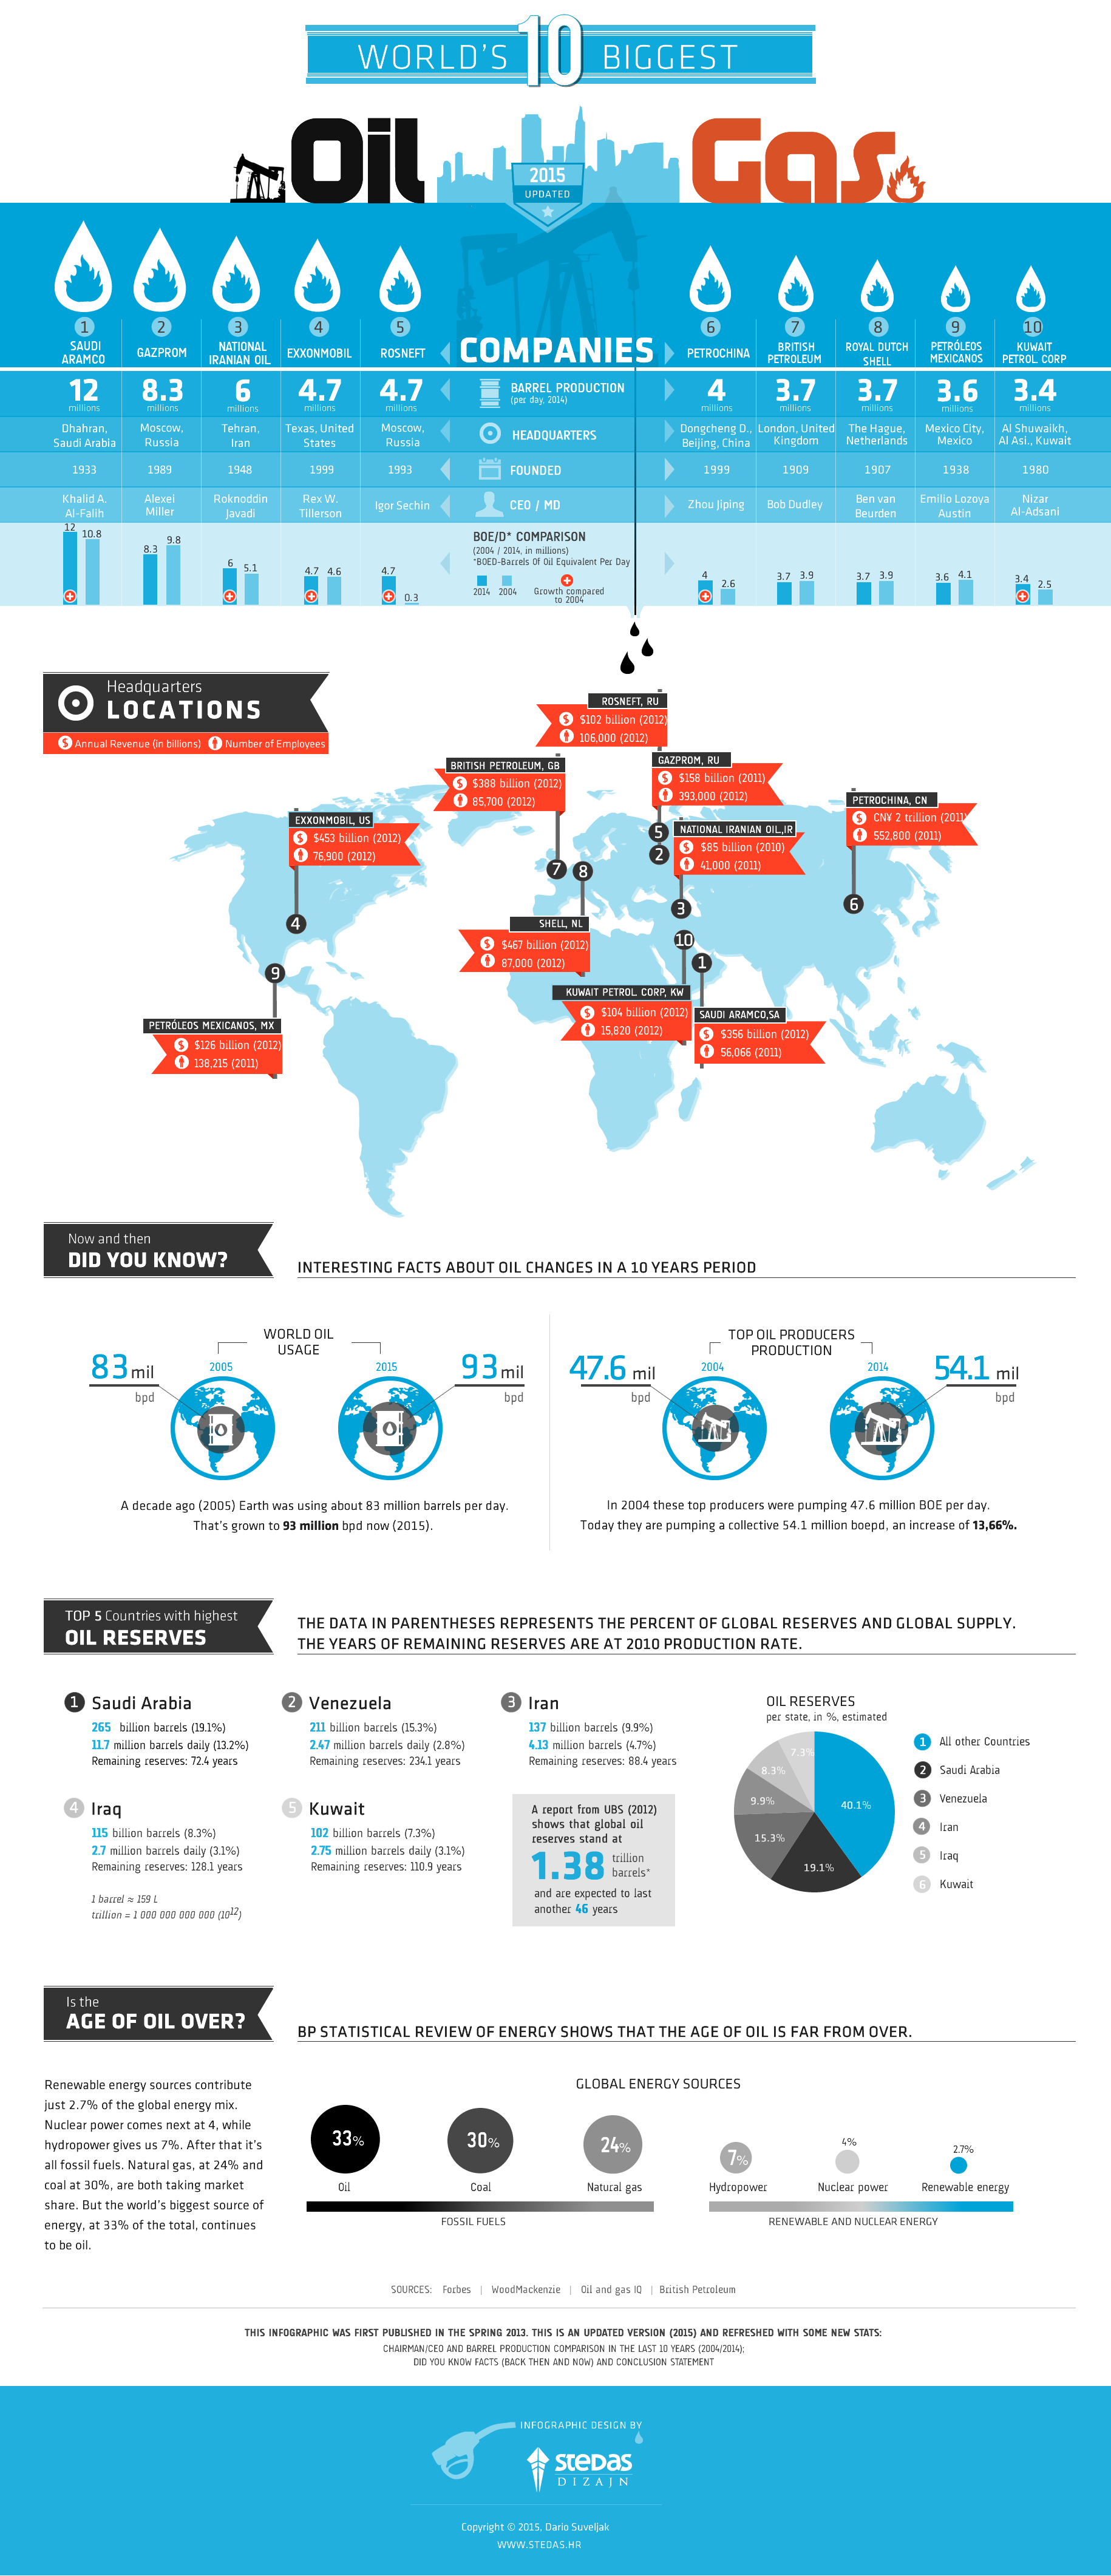
The World’s 10 Biggest Oil and Gas Companies
Note: to see the bigger version of this infographic, click here.
Today’s infographic not only ranks oil producers based on factors such as barrel production per day, but it also compares data from a decade ago with today’s information for better perspective.
From 2005 to 2015, global oil usage has only increased from 83 million to 93 million bpd (1.13% CAGR). However, the overall rate at which the Top 10 has grown production has been at a 1.29% CAGR pace, and their production now makes up about 58% of all global production.
The companies with the most impressive increases over this time are all state-owned. Saudi Aramco, the world’s largest producer, increased production from 10.8 million bpd (2004) to 12 million bpd (2014). Rosneft, National Iranian Oil, Petrochina, and Kuwait Petrol Corp all saw sizeable increases. The only company to see a big decrease was also state-owned (Gazprom).
Oil and gas continues to make up the majority of the global energy mix with 33% and natural gas at 24%. That said, based on the CAGRs above, it does seem that we are making progress in tapering the growth of production. Human population and the economy are growing at rates higher than 1.13%, so that means oil is giving up ground to other energy sources.
If you liked visuals on the world’s 10 biggest oil and gas companies, don’t forget to view our presentation on how much oil and other energy types it takes to power New York for a year, or our chart on which country has parabolic growth in wind power capacity.
Original graphic by: Stedas


Who’s Building the Most Solar Energy?
This was originally posted on our Voronoi app. Download the app for free on iOS or Android and discover incredible data-driven charts from a variety of trusted sources.
In 2023, solar energy accounted for three-quarters of renewable capacity additions worldwide. Most of this growth occurred in Asia, the EU, and the U.S., continuing a trend observed over the past decade.
In this graphic, we illustrate the rise in installed solar photovoltaic (PV) capacity in China, the EU, and the U.S. between 2010 and 2022, measured in gigawatts (GW). Bruegel compiled the data..
Chinese Dominance
As of 2022, China’s total installed capacity stands at 393 GW, nearly double that of the EU’s 205 GW and surpassing the USA’s total of 113 GW by more than threefold in absolute terms.
| Installed solar capacity (GW) | China | EU27 | U.S. |
|---|---|---|---|
| 2022 | 393.0 | 205.5 | 113.0 |
| 2021 | 307.0 | 162.7 | 95.4 |
| 2020 | 254.0 | 136.9 | 76.4 |
| 2019 | 205.0 | 120.1 | 61.6 |
| 2018 | 175.3 | 104.0 | 52.0 |
| 2017 | 130.8 | 96.2 | 43.8 |
| 2016 | 77.8 | 91.5 | 35.4 |
| 2015 | 43.6 | 87.7 | 24.2 |
| 2014 | 28.4 | 83.6 | 18.1 |
| 2013 | 17.8 | 79.7 | 13.3 |
| 2012 | 6.7 | 71.1 | 8.6 |
| 2011 | 3.1 | 53.3 | 5.6 |
| 2010 | 1.0 | 30.6 | 3.4 |
Since 2017, China has shown a compound annual growth rate (CAGR) of approximately 25% in installed PV capacity, while the USA has seen a CAGR of 21%, and the EU of 16%.
Additionally, China dominates the production of solar power components, currently controlling around 80% of the world’s solar panel supply chain.
In 2022, China’s solar industry employed 2.76 million individuals, with manufacturing roles representing approximately 1.8 million and the remaining 918,000 jobs in construction, installation, and operations and maintenance.
The EU industry employed 648,000 individuals, while the U.S. reached 264,000 jobs.
According to the IEA, China accounts for almost 60% of new renewable capacity expected to become operational globally by 2028.
Despite the phasing out of national subsidies in 2020 and 2021, deployment of solar PV in China is accelerating. The country is expected to reach its national 2030 target for wind and solar PV installations in 2024, six years ahead of schedule.

-

 Markets5 days ago
Visualizing Global Inflation Forecasts (2024-2026)
-

 Green2 weeks ago
The Carbon Footprint of Major Travel Methods
-

 United States2 weeks ago
Visualizing the Most Common Pets in the U.S.
-

 Culture2 weeks ago
The World’s Top Media Franchises by All-Time Revenue
-

 voronoi1 week ago
Best Visualizations of April on the Voronoi App
-

 Wealth1 week ago
Charted: Which Country Has the Most Billionaires in 2024?
-

 Business1 week ago
The Top Private Equity Firms by Country
-

 Markets1 week ago
The Best U.S. Companies to Work for According to LinkedIn