Markets
The $109 Trillion Global Stock Market in One Chart
Subscribe to the Advisor Channel free mailing list for more like this
The $109 Trillion Global Stock Market in One Chart
This was originally posted on Advisor Channel. Sign up to the free mailing list to get beautiful visualizations on financial markets that help advisors and their clients.
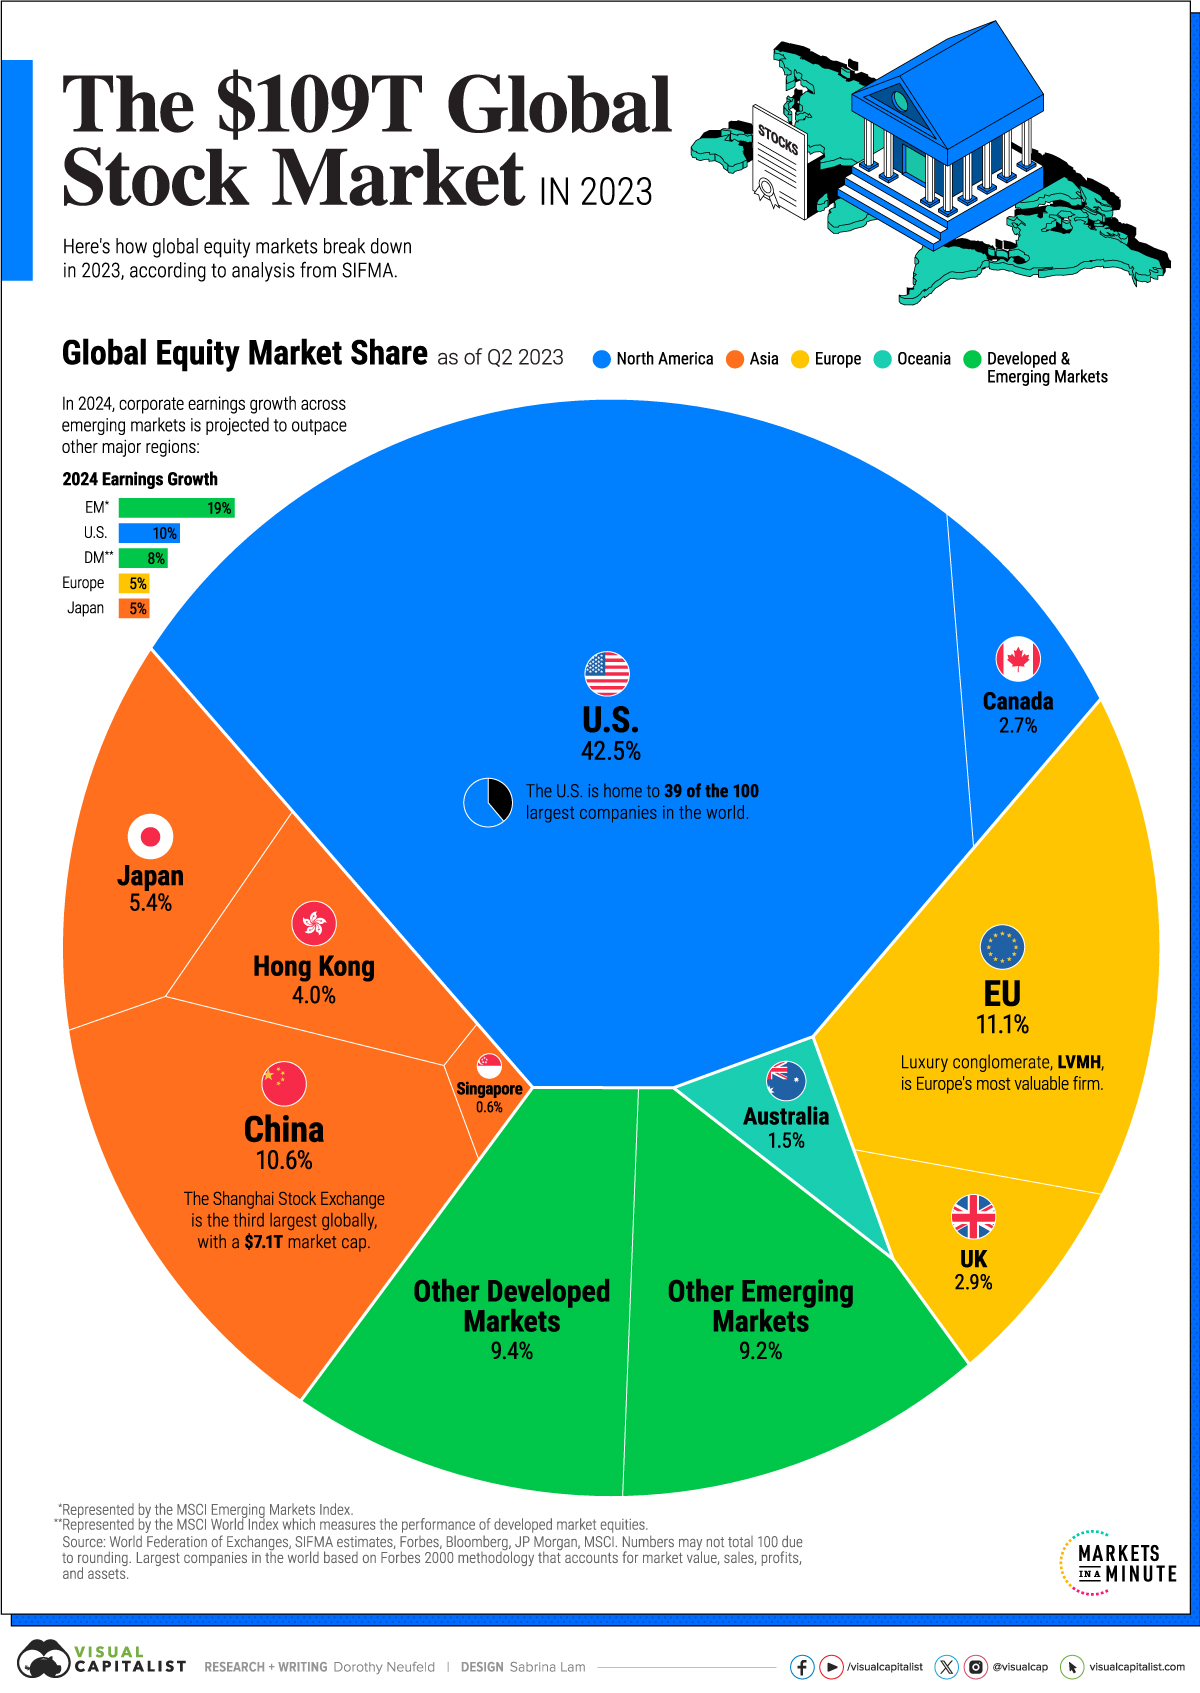
Global equity markets have nearly tripled in size since 2003, climbing to $109 trillion in total market capitalization.
Over the last several decades, the growth in money supply and ultra-low interest rates have underpinned rising asset values across economies.
Given this backdrop, the above graphic shows the size of the global stock market in 2023, based on data from the World Federation of Exchanges (WFE) and the Securities Industry and Financial Markets Association (SIFMA).
The Global Stock Market, by Share
With the world’s deepest capital markets, the U.S. makes up 42.5% of global equity market capitalization, outpacing the next closest economy, the European Union by a significant margin.
Here are the world’s major equity markets based on global market cap share as of Q2 2023:
| Country / Region | Market Cap | Share (%) |
|---|---|---|
| 🇺🇸 U.S. | $46.2T | 42.5% |
| 🇪🇺 EU | $12.1T | 11.1% |
| 🇨🇳 China | $11.5T | 10.6% |
| 🇯🇵 Japan | $5.8T | 5.4% |
| 🇭🇰 Hong Kong | $4.3T | 4.0% |
| 🇬🇧 UK | $3.2T | 2.9% |
| 🇨🇦 Canada | $3.0T | 2.7% |
| 🇦🇺 Australia | $1.7T | 1.5% |
| 🇸🇬 Singapore | $0.6T | 0.6% |
| 🌏 Rest of Developed Markets | $10.2T | 9.4% |
| 🌍 Rest of Emerging Markets | $10.0T | 9.2% |
| Global Total | $108.6T | 100.0% |
Data as of Q2 2023. Numbers may not total 100 due to rounding.
Today, U.S. equity markets total over $46.2 trillion in market capitalization.
Compared to other rich nations, U.S. stocks have often outperformed over the last several decades. If an investor put $100 in the S&P 500 in 1990 this investment would have grown to about $2,000 in 2023, or four-fold the returns seen in other developed countries.
The second-largest equity market is the European Union at 11.1% of global share, followed by China, at 10.6%.
In the last 20 years, China’s economy has increased by roughly 12-fold, reaching $19.4 trillion this year. China’s equity markets have also grown considerably, fueled by the incorporation of Chinese domestic stocks into the MSCI Emerging Market Index in 2018, and earlier, with the internationalization of its equity markets in 2002.
Japan’s equity markets account for 5.4% of the global share, followed by Hong Kong, at 4%.
The Future Investment Landscape
Goldman Sachs projects that U.S. equity market capitalization will fall to 35% of the overall global market by 2030.
Meanwhile, emerging markets, including China and India, are collectively forecast to reach the 35% mark in the same timeframe. By 2050, the EM share is anticipated to far surpass the U.S., rising to 47% of global stock markets.
| Country / Region | Global Equity Market Share 2030 | Global Equity Market Share 2050 |
|---|---|---|
| 🇺🇸 U.S. | 34.7% | 26.9% |
| 🇪🇺 Euro Area | 8.3% | 7.9% |
| 🇨🇳 China | 14.1% | 15.0% |
| 🇮🇳 India | 4.1% | 8.3% |
| 🌏 Rest of Developed Markets | 21.5% | 17.8% |
| 🌍 Rest of Emerging Markets | 17.4% | 24.1% |
Numbers may not total 100 due to rounding.
The first factor underscoring this shift is the rapid growth projected for emerging economies.
Historically, as GDP per capita grows, capital markets in an economy become more sophisticated. We can see this in richer countries, which tend to have higher equitization of their markets.
India is projected to rise the fastest globally. By 2030, it is projected to account for 4.1% of global equity market cap. Furthermore, by 2050, this share is projected to outrank the euro area due to strong GDP per capita growth and demographic drivers.
The second factor, although to a lesser extent, is emerging market rising valuation multiples driven by higher GDP per capita. Richer countries, as seen in the U.S., often trade at higher earnings multiples because they are viewed to have lower risk.
Implications for Investors
What does this mean from an investment standpoint?
While the U.S. has outperformed in recent decades, it may not mean that it will continue on this trend, according to Goldman Sachs. Given the structural shifts stemming from growing populations and GDP growth, investors may consider diversifying their portfolios geographically looking ahead.


Markets
Visualized: Interest Rate Forecasts for Advanced Economies
In this graphic, we show the IMF’s interest rate forecast for the U.S., Europe, the UK, and Japan for the next five years ahead.
Interest Rate Projections for Advanced Economies
While U.S. inflation cooled in the second half of last year, price pressures returned in 2024, leading investors to rethink how soon central bankers will cut rates.
Despite the recent increase, the interest rate forecast for many economies looks optimistic, thanks to subdued energy price shocks and abating supply chain disruptions. Still, short-term risks remain, including persistently high services inflation clouding the outlook.
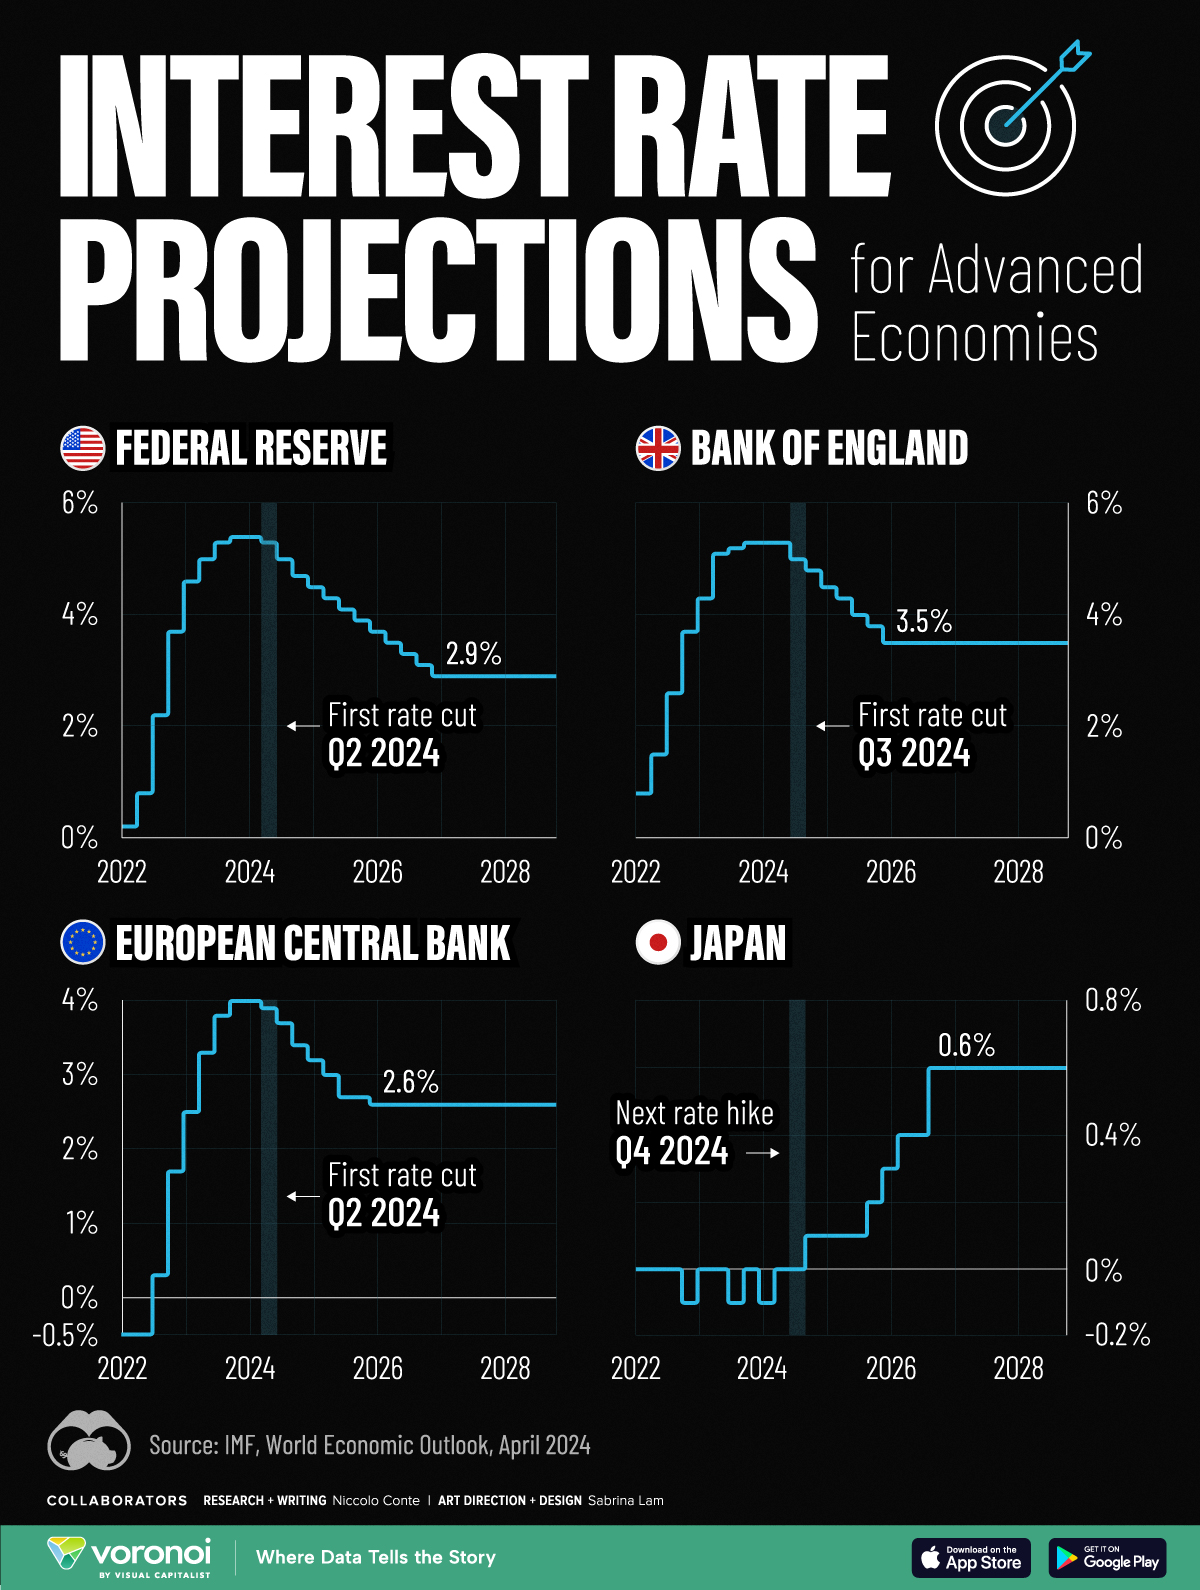
This graphic shows the interest rate forecast for advanced economies, based on the International Monetary Fund’s (IMF) 2024 World Economic Outlook.
Get the Key Insights of the IMF’s World Economic Outlook
Want a visual breakdown of the insights from the IMF’s 2024 World Economic Outlook report?
This visual is part of a special dispatch of the key takeaways exclusively for VC+ members.
Get the full dispatch of charts by signing up to VC+.
A Closer Look at the IMF Interest Rate Forecast
Below, we show the projected path of interest rates based on the IMF’s latest data:
| Federal Reserve | Bank of England | ECB | Bank of Japan | |
|---|---|---|---|---|
| Q1 2024 | 5.4% | 4.0% | -0.1% | 5.3% |
| Q2 2024 | 5.3% | 3.9% | 0.0% | 5.3% |
| Q3 2024 | 5.0% | 3.7% | 0.0% | 5.0% |
| Q4 2024 | 4.7% | 3.4% | 0.1% | 4.8% |
| Q1 2025 | 4.5% | 3.2% | 0.1% | 4.5% |
| Q2 2025 | 4.3% | 3.0% | 0.1% | 4.3% |
| Q3 2025 | 4.1% | 2.7% | 0.1% | 4.0% |
| Q4 2025 | 3.9% | 2.7% | 0.2% | 3.8% |
| Q1 2026 | 3.7% | 2.6% | 0.3% | 3.5% |
| Q2 2026 | 3.5% | 2.6% | 0.4% | 3.5% |
| Q3 2026 | 3.3% | 2.6% | 0.4% | 3.5% |
| Q4 2026 | 3.1% | 2.6% | 0.6% | 3.5% |
| Q1 2027 | 2.9% | 2.6% | 0.6% | 3.5% |
| Q2 2027 | 2.9% | 2.6% | 0.6% | 3.5% |
| Q3 2027 | 2.9% | 2.6% | 0.6% | 3.5% |
| Q4 2027 | 2.9% | 2.6% | 0.6% | 3.5% |
| Q1 2028 | 2.9% | 2.6% | 0.6% | 3.5% |
| Q2 2028 | 2.9% | 2.6% | 0.6% | 3.5% |
| Q3 2028 | 2.9% | 2.6% | 0.6% | 3.5% |
| Q4 2028 | 2.9% | 2.6% | 0.6% | 3.5% |
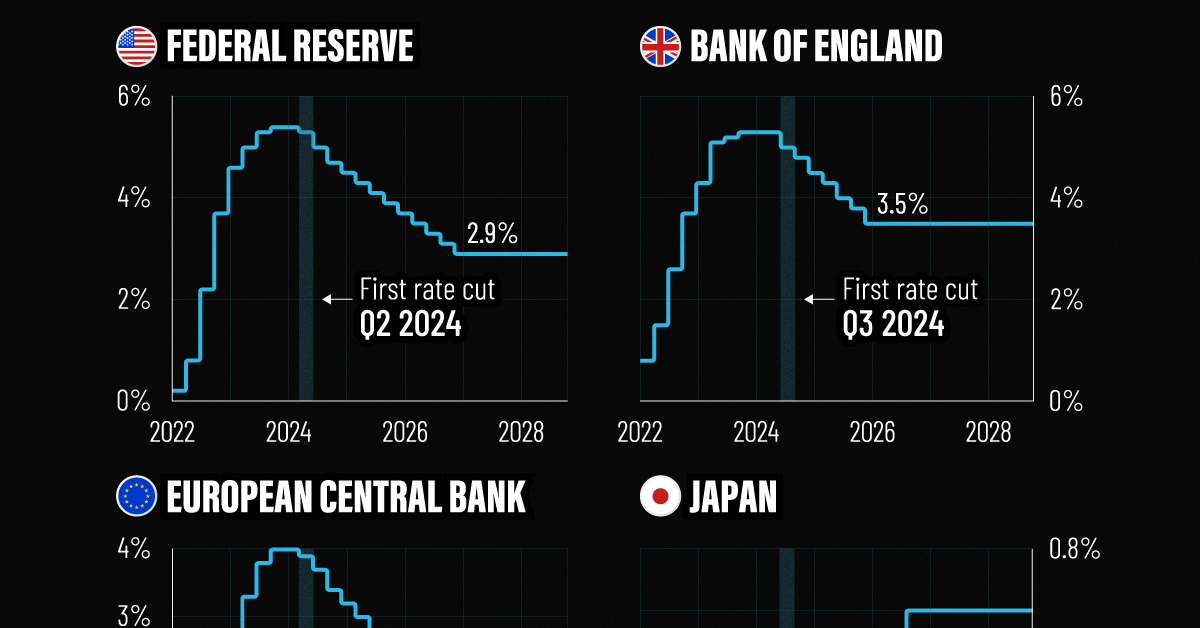
As we can see, the U.S. is forecast to see its first rate cut in the second quarter of 2024.
Broadly speaking, rates will be cut very gradually, with two additional rate cuts anticipated for this year. By 2027, interest rates are projected to fall to 2.9% after a series of moderate rate cuts as inflation dissipates.
Like the U.S., the European Central Bank is forecast to cut rates in the second quarter of 2024, with rates set to fall to 2.6% by 2026. While inflation has cooled at a faster rate across Europe compared to the U.S., GDP growth is also projected to be more muted. This year, the IMF projects that GDP across the euro area will increase just 0.8% versus 2.7% for the U.S. economy.
In the UK, monetary easing is projected to move more gradually, with the first cut projected for the third quarter of this year. Growth across the UK economy is projected to be tepid for 2024, weighed down by the impact of higher rates, lower productivity, and sluggish investment growth.
Rates Rising Slowly in Japan
After years of enduring negative interest rates, Japan raised its short-term policy rate to 0.0-0.1% in March 2024.
This was due in part to a promising inflation outlook over the coming years. The IMF projects that the next rate hike will take place in the fourth quarter of 2024, as it moves away from a multi-decade battle with deflation.
Get the Full Analysis of the IMF’s Outlook on VC+
This visual is part of an exclusive special dispatch for VC+ members which breaks down the key takeaways from the IMF’s 2024 World Economic Outlook.
For the full set of charts and analysis, sign up for VC+.

-

 Wealth6 days ago
Charted: Which City Has the Most Billionaires in 2024?
-

 Mining2 weeks ago
Gold vs. S&P 500: Which Has Grown More Over Five Years?
-

 Uranium2 weeks ago
The World’s Biggest Nuclear Energy Producers
-

 Education2 weeks ago
How Hard Is It to Get Into an Ivy League School?
-

 Debt2 weeks ago
How Debt-to-GDP Ratios Have Changed Since 2000
-

 Sports2 weeks ago
The Highest Earning Athletes in Seven Professional Sports
-

 Science2 weeks ago
Visualizing the Average Lifespans of Mammals
-

 Brands1 week ago
How Tech Logos Have Evolved Over Time