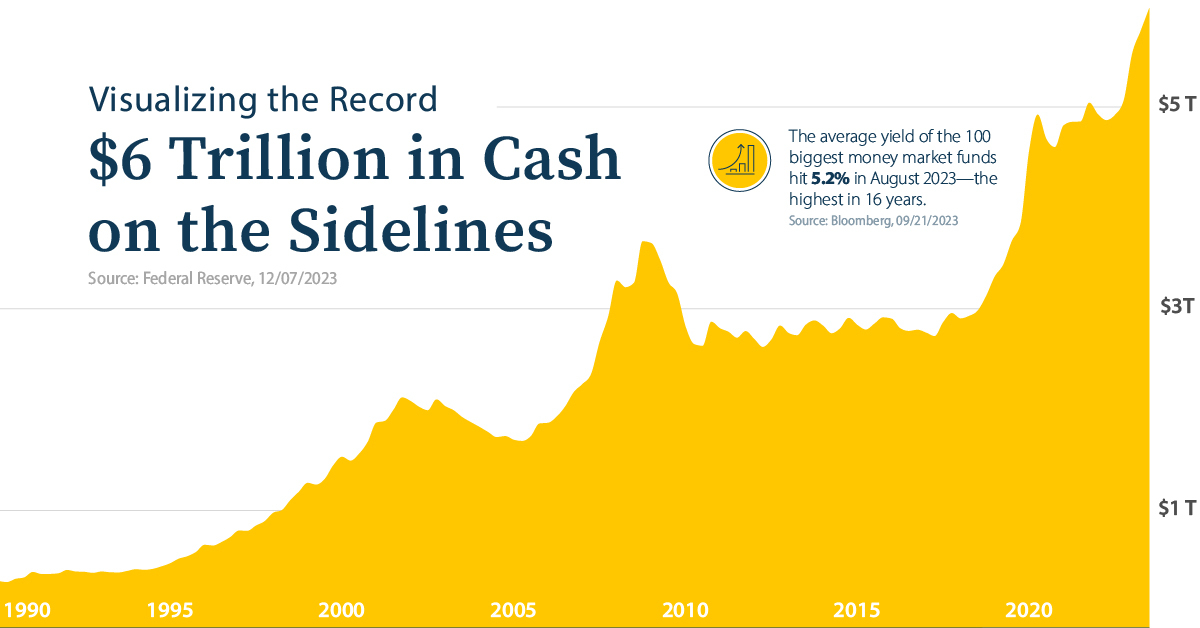
Visualizing the Record $6 Trillion in Cash on the Sidelines
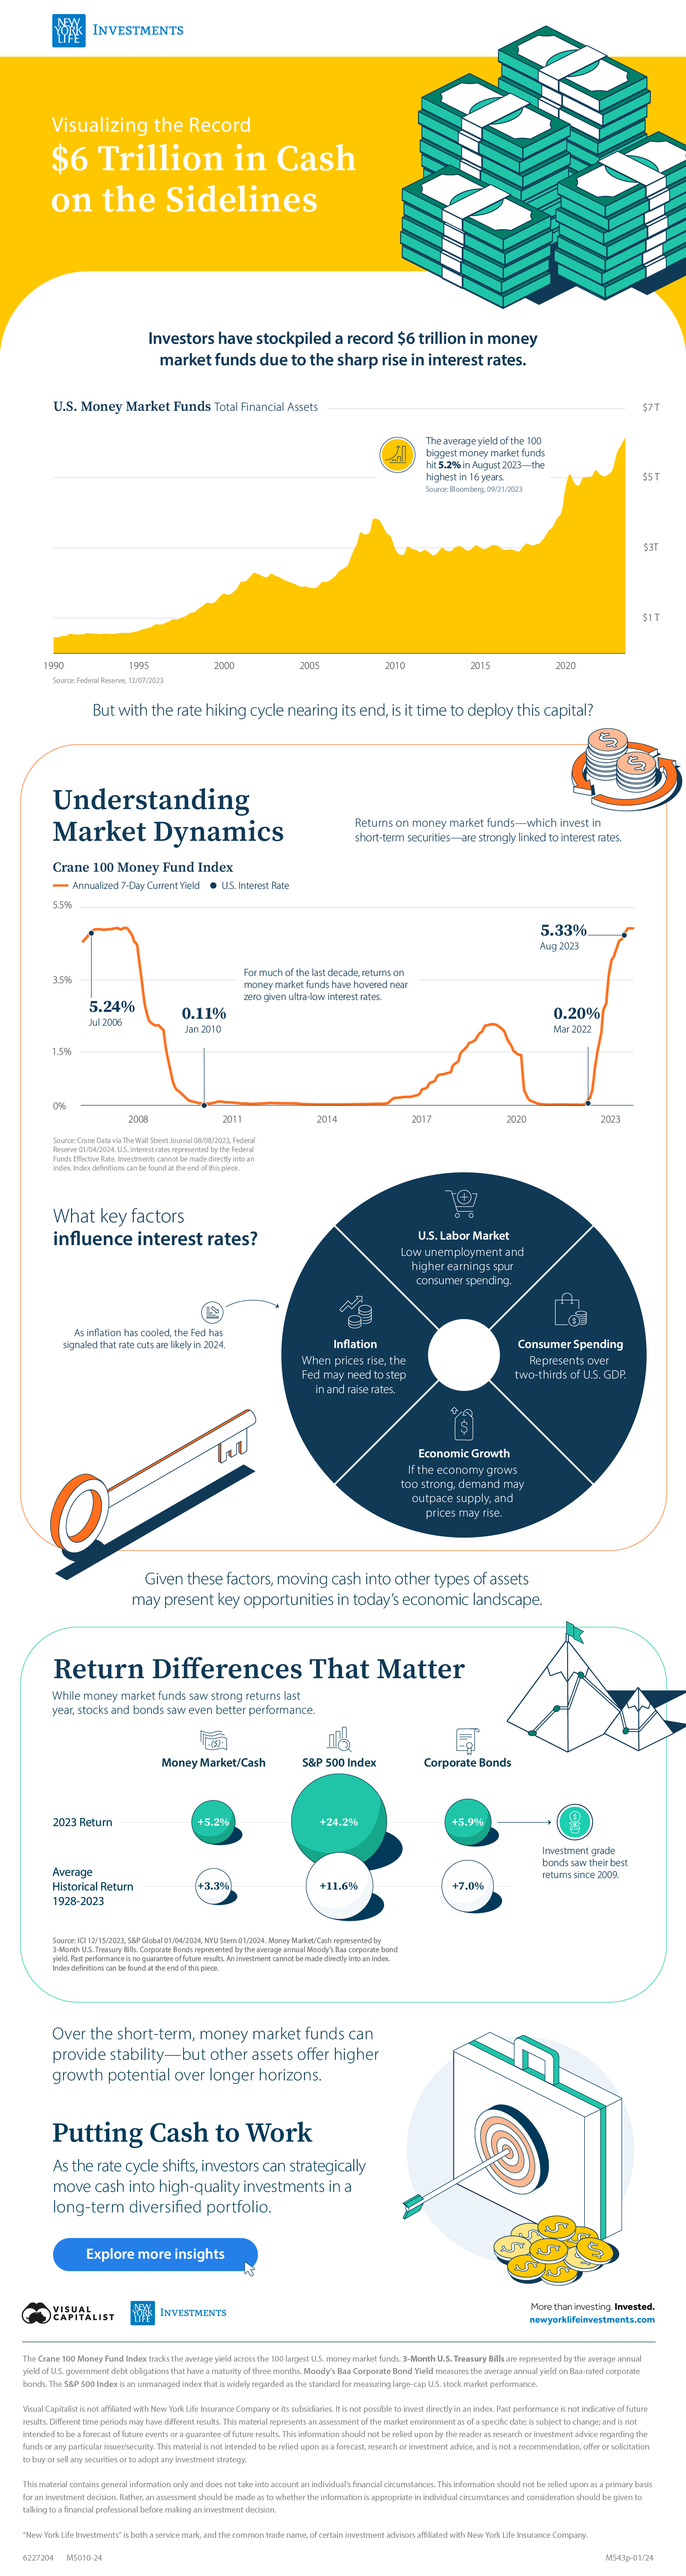
Visualizing the Record $6 Trillion in Cash on the Sidelines
Investors have stockpiled a record $6.1 trillion in money market funds due to the sharp rise in interest rates driving up higher yields over the last few years.
These low-risk, highly liquid investments serve as an alternative to cash, investing in assets like Treasuries. Since the end of 2019, their total assets have increased by over 50%.
This graphic, sponsored by New York Life Investments, shows the wall of cash on the sidelines.
The Growth in Money Market Funds
In 2023, investors increasingly began piling into money market funds, with assets growing by $900 billion in the first three quarters alone.
Often, investors put their cash in money market funds when they are waiting to invest it or they need the money in the short term. The benefit of these funds is that they can offer higher yields than holding cash in a bank account, which helps offset the impact of inflation.
| Date | Money Market Fund Total Financial Assets |
|---|---|
| 2023 | $6.1T |
| 2022 | $5.2T |
| 2021 | $5.2T |
| 2020 | $4.8T |
| 2019 | $4.0T |
| 2018 | $3.3T |
| 2017 | $3.0T |
| 2016 | $2.9T |
| 2015 | $3.0T |
| 2014 | $3.0T |
| 2013 | $3.0T |
| 2012 | $2.9T |
| 2011 | $3.0T |
| 2010 | $3.0T |
| 2009 | $3.8T |
| 2008 | $3.4T |
| 2007 | $2.4T |
| 2006 | $2.0T |
| 2005 | $1.9T |
| 2004 | $2.0T |
| 2003 | $2.2T |
| 2002 | $2.2T |
| 2001 | $2.0T |
| 2000 | $1.7T |
| 1999 | $1.4T |
| 1998 | $1.1T |
| 1997 | $965B |
| 1996 | $824B |
| 1995 | $642B |
| 1994 | $582B |
| 1993 | $560B |
| 1992 | $575B |
| 1991 | $555B |
| 1990 | $466B |
Source: Federal Reserve, 12/07/2023. Based on data from the fourth quarter of every year, except for 2023 which uses the latest available data from the third quarter.
As the Federal Reserve hiked rates at the fastest pace in decades, the average yield of the 100 biggest money market funds climbed to 5.2% in August 2023—the highest in 16 years.
But with the rate hiking cycle nearing its end, yields on these funds may become less attractive if interest rates fall.
Understanding Market Dynamics
With inflation moderating from over 6% in January 2023 to 3.4% in December, the Fed signaled that rate cuts are likely in 2024.
Adding to this, Treasury Secretary Janet Yellen stated that the U.S. economy had successfully achieved a “soft landing” amid strong economic growth and a resilient job market that saw nearly half a million new jobs added in 2023.
With this in mind, investors will be closely watching the following factors that can influence interest rates:
- U.S. Labor Market: Low unemployment and higher earnings spur consumer spending.
- Consumer Spending: Makes up over two-thirds of U.S. GDP.
- Economic Growth: If the economy grows too strong, demand may outpace supply, and prices may rise.
- Inflation: When prices rise, the Fed may need to step in and raise rates. If prices stabilize or fall due to slowing demand, the Fed may cut rates to spur investment and spending.
While the Fed is cautious about cutting rates too soon, investors are optimistic that it could happen as early as May 2024. Given this outlook, moving cash into other types of assets may present key opportunities in today’s landscape.
Return Differences That Matter
While money market funds saw strong returns last year, stocks and bonds saw even better performance.
| Money Market/Cash | S&P 500 Index | Corporate Bonds | |
|---|---|---|---|
| 2023 Return | +5.2% | +24.2% | +5.9% |
| Average Historical Return 1928-2023 | +3.3% | +11.6% | +7.0% |
Source: ICI 12/15/2023, S&P Global 01/04/2024, NYU Stern 01/2024. Money Market/Cash represented by 3-Month U.S. Treasury Bills. Corporate Bonds represented by the average annual Moody’s Baa corporate bond yield.
Especially over time, these differences can add up significantly. Consider that $100 invested in cash equivalent securities would have grown to $2,249 between 1928 and 2023, while $100 invested in the S&P 500 would have grown to over $787,000.
Over the short term, money market funds can provide stability—but other assets offer higher growth potential over longer horizons.
Putting Cash to Work
Cooling inflation and a resilient U.S. economy may suggest that the worst is over.
Whether or not the Fed decides to cut interest rates will largely depend on economic data that is released over the coming months. With the U.S. stock market currently at record highs, it’s apparent that investors are hopeful that rate cuts could happen this year.
As the rate cycle shifts, investors can strategically allocate funds to high-quality investments within a well-diversified, long-term portfolio as declining rates likely result in lower returns on money market funds.
Explore more investment insights with New York Life Investments.

-

 Economy3 days ago
Economic Growth Forecasts for G7 and BRICS Countries in 2024
The IMF has released its economic growth forecasts for 2024. How do the G7 and BRICS countries compare?
-

 Markets2 weeks ago
U.S. Debt Interest Payments Reach $1 Trillion
U.S. debt interest payments have surged past the $1 trillion dollar mark, amid high interest rates and an ever-expanding debt burden.
-

 United States2 weeks ago
Ranked: The Largest U.S. Corporations by Number of Employees
We visualized the top U.S. companies by employees, revealing the massive scale of retailers like Walmart, Target, and Home Depot.
-

 Markets2 weeks ago
The Top 10 States by Real GDP Growth in 2023
This graphic shows the states with the highest real GDP growth rate in 2023, largely propelled by the oil and gas boom.
-

 Markets3 weeks ago
Ranked: The World’s Top Flight Routes, by Revenue
In this graphic, we show the highest earning flight routes globally as air travel continued to rebound in 2023.
-

 Markets3 weeks ago
Ranked: The Most Valuable Housing Markets in America
The U.S. residential real estate market is worth a staggering $47.5 trillion. Here are the most valuable housing markets in the country.