What’s Driving U.S. Stock Market Returns?
What’s Driving U.S. Stock Market Returns?
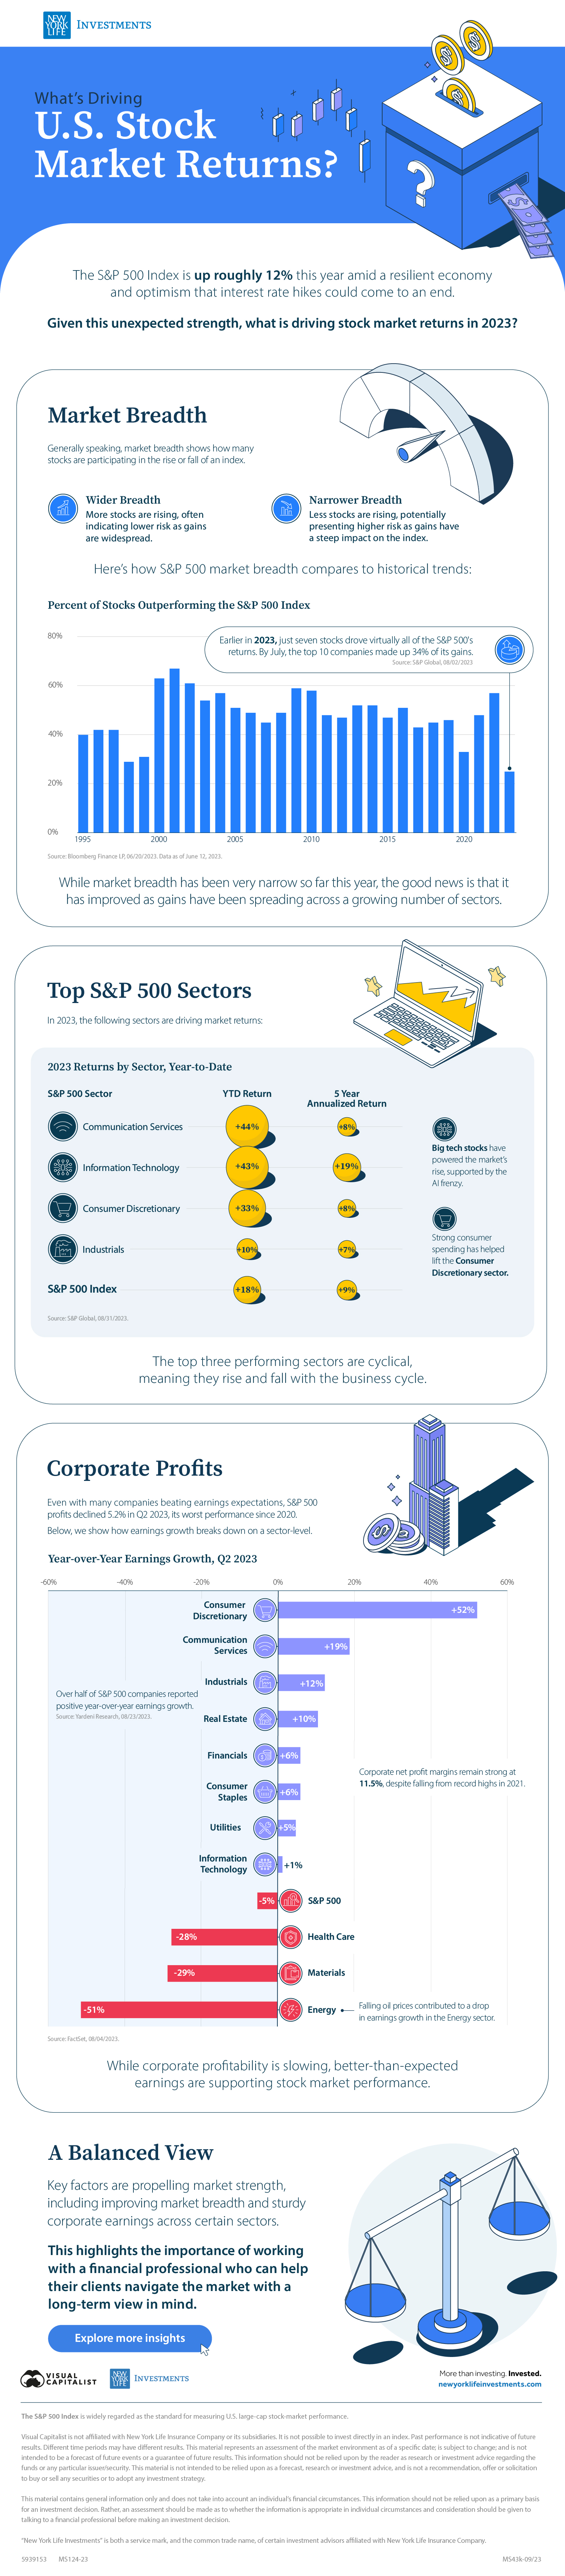
In many ways, U.S. stock market returns in 2023 have defied expectations. Strong U.S. economic activity, a robust labor market, and consumer spending have helped spur investor optimism. Year-to-date, the S&P 500 is up roughly 12%.
Given this unexpected strength, the above graphic, sponsored by New York Life Investments, explores key factors fueling stock market returns in 2023.
Market Breadth
Generally speaking, the concept of market breadth shows how many stocks are participating in the rise or fall of an index.
Wider Breadth: More stocks are rising, often indicating lower risk as gains are widespread.
Narrower Breadth: Fewer stocks are rising, potentially presenting higher risk as gains have a steep impact on the index.
Earlier in 2023, just seven stocks drove virtually all of the S&P 500’s returns. By July, the top 10 companies made up 34% of its gains. Here’s how S&P 500 market breadth compares to historical trends:
| Year | Percent of Stocks Outperforming the S&P 500 Index |
|---|---|
| 2023* | 25% |
| 2022 | 57% |
| 2021 | 48% |
| 2020 | 33% |
| 2019 | 46% |
| 2018 | 45% |
| 2017 | 43% |
| 2016 | 51% |
| 2015 | 47% |
| 2014 | 52% |
| 2013 | 52% |
| 2012 | 47% |
| 2011 | 48% |
| 2010 | 58% |
| 2009 | 59% |
| 2008 | 49% |
| 2007 | 45% |
| 2006 | 49% |
| 2005 | 51% |
| 2004 | 57% |
| 2003 | 54% |
| 2002 | 61% |
| 2001 | 67% |
| 2000 | 63% |
| 1999 | 31% |
| 1998 | 29% |
| 1997 | 42% |
| 1996 | 42% |
| 1995 | 40% |
Source: Bloomberg Finance LP, 06/20/2023. *Data as of June 12, 2023.
While market breadth has been very narrow so far this year, the good news is that it has improved with gains spreading across a growing number of sectors.
Top S&P 500 Sectors
In 2023, the following sectors are driving market returns. Number have been rounded:
| S&P 500 Sector | YTD Return | 5-Year Annualized Return |
|---|---|---|
| Communication Services | +44% | +8% |
| Information Technology | +43% | +19% |
| Consumer Discretionary | +33% | +8% |
| Industrials | +10% | +7% |
| S&P 500 Index | +18% | +9% |
Source: S&P Global, 08/31/2023.
Big tech stocks have powered the market’s rise, supported by the AI frenzy. Additionally, strong consumer spending has helped lift the Consumer Discretionary sector.
Overall, we can see the top three performing sectors are cyclical, meaning they rise and fall with the business cycle.
Corporate Earnings
Even with many companies beating earnings expectations, year-over-year S&P 500 profits declined 5.2% in Q2 2023, its worst performance since 2020.
Below, we show how earnings growth breaks down by sector. Numbers have been rounded.
| S&P 500 Sector | Year-over-Year Earnings Growth Q2 2023 |
|---|---|
| Consumer Discretionary | +52% |
| Communication Services | +19% |
| Industrials | +12% |
| Real Estate | +10% |
| Financials | +6% |
| Consumer Staples | +6% |
| Utilities | +5% |
| Information Technology | +1% |
| Health Care | -28% |
| Materials | -29% |
| Energy | -51% |
| S&P 500 Index | -5% |
Source: FactSet, 08/04/2023.
As of Q2 2023, over half of S&P 500 companies reported positive year-over-year earnings growth. Furthermore, corporate net profit margins remain strong at 11.5%, despite falling from record highs in 2021.
While corporate profitability is slowing, better-than-expected earnings are supporting stock market performance.
Stock Market Returns: A Balanced View
Today, improving market breadth and sturdy corporate earnings across key sectors are supporting the market’s strength.
These factors, along with a solid macroeconomic backdrop, are leading to a brighter economic outlook in the coming year. As a result, investors see a higher likelihood of the economy achieving a soft landing.
In an ever-changing environment, it highlights the importance of working with a financial professional who can provide their clients with actionable and balanced strategies and help them stay on track as they navigate today’s market.
Explore more investment insights with New York Life Investments.

-

 Business3 hours ago
The Top Private Equity Firms by Country
This map visualizes the leading private equity firms of major countries, ranked by capital raised over the past five years.
-

 Economy5 days ago
Economic Growth Forecasts for G7 and BRICS Countries in 2024
The IMF has released its economic growth forecasts for 2024. How do the G7 and BRICS countries compare?
-

 Markets2 weeks ago
U.S. Debt Interest Payments Reach $1 Trillion
U.S. debt interest payments have surged past the $1 trillion dollar mark, amid high interest rates and an ever-expanding debt burden.
-

 Business2 weeks ago
Ranked: The Largest U.S. Corporations by Number of Employees
We visualized the top U.S. companies by employees, revealing the massive scale of retailers like Walmart, Target, and Home Depot.
-

 Markets3 weeks ago
The Top 10 States by Real GDP Growth in 2023
This graphic shows the states with the highest real GDP growth rate in 2023, largely propelled by the oil and gas boom.
-

 Markets3 weeks ago
Ranked: The World’s Top Flight Routes, by Revenue
In this graphic, we show the highest earning flight routes globally as air travel continued to rebound in 2023.
