Cross-Border Payments: A $150 Trillion Catalyst for Economic Growth
Cross-Border Payments: A US$150 Trillion Catalyst
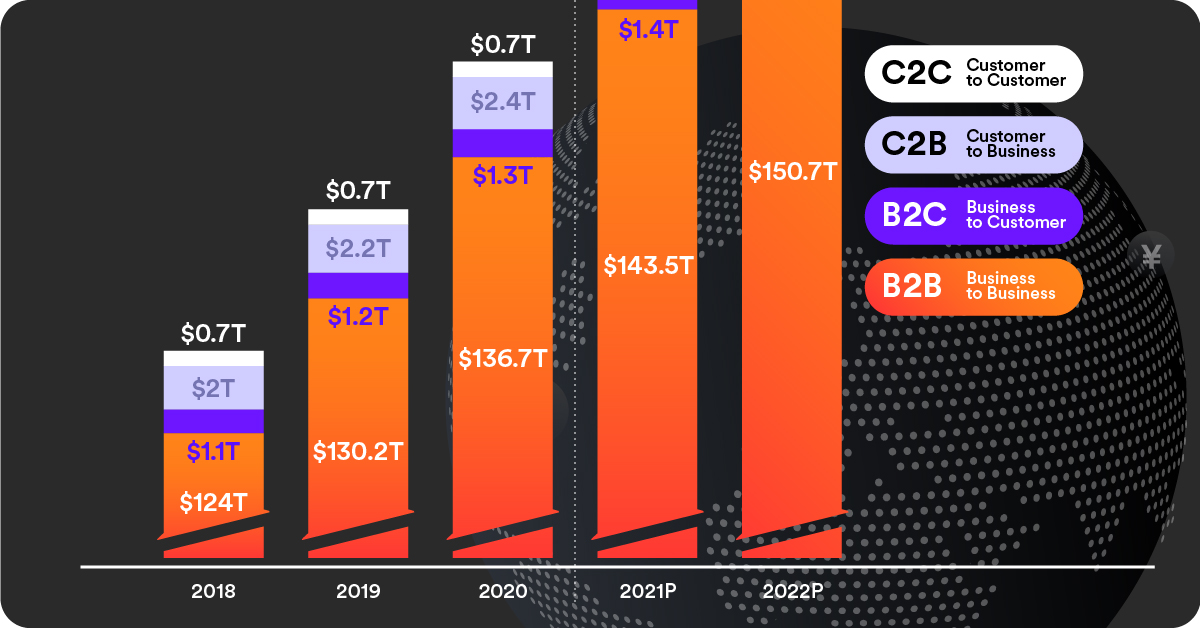
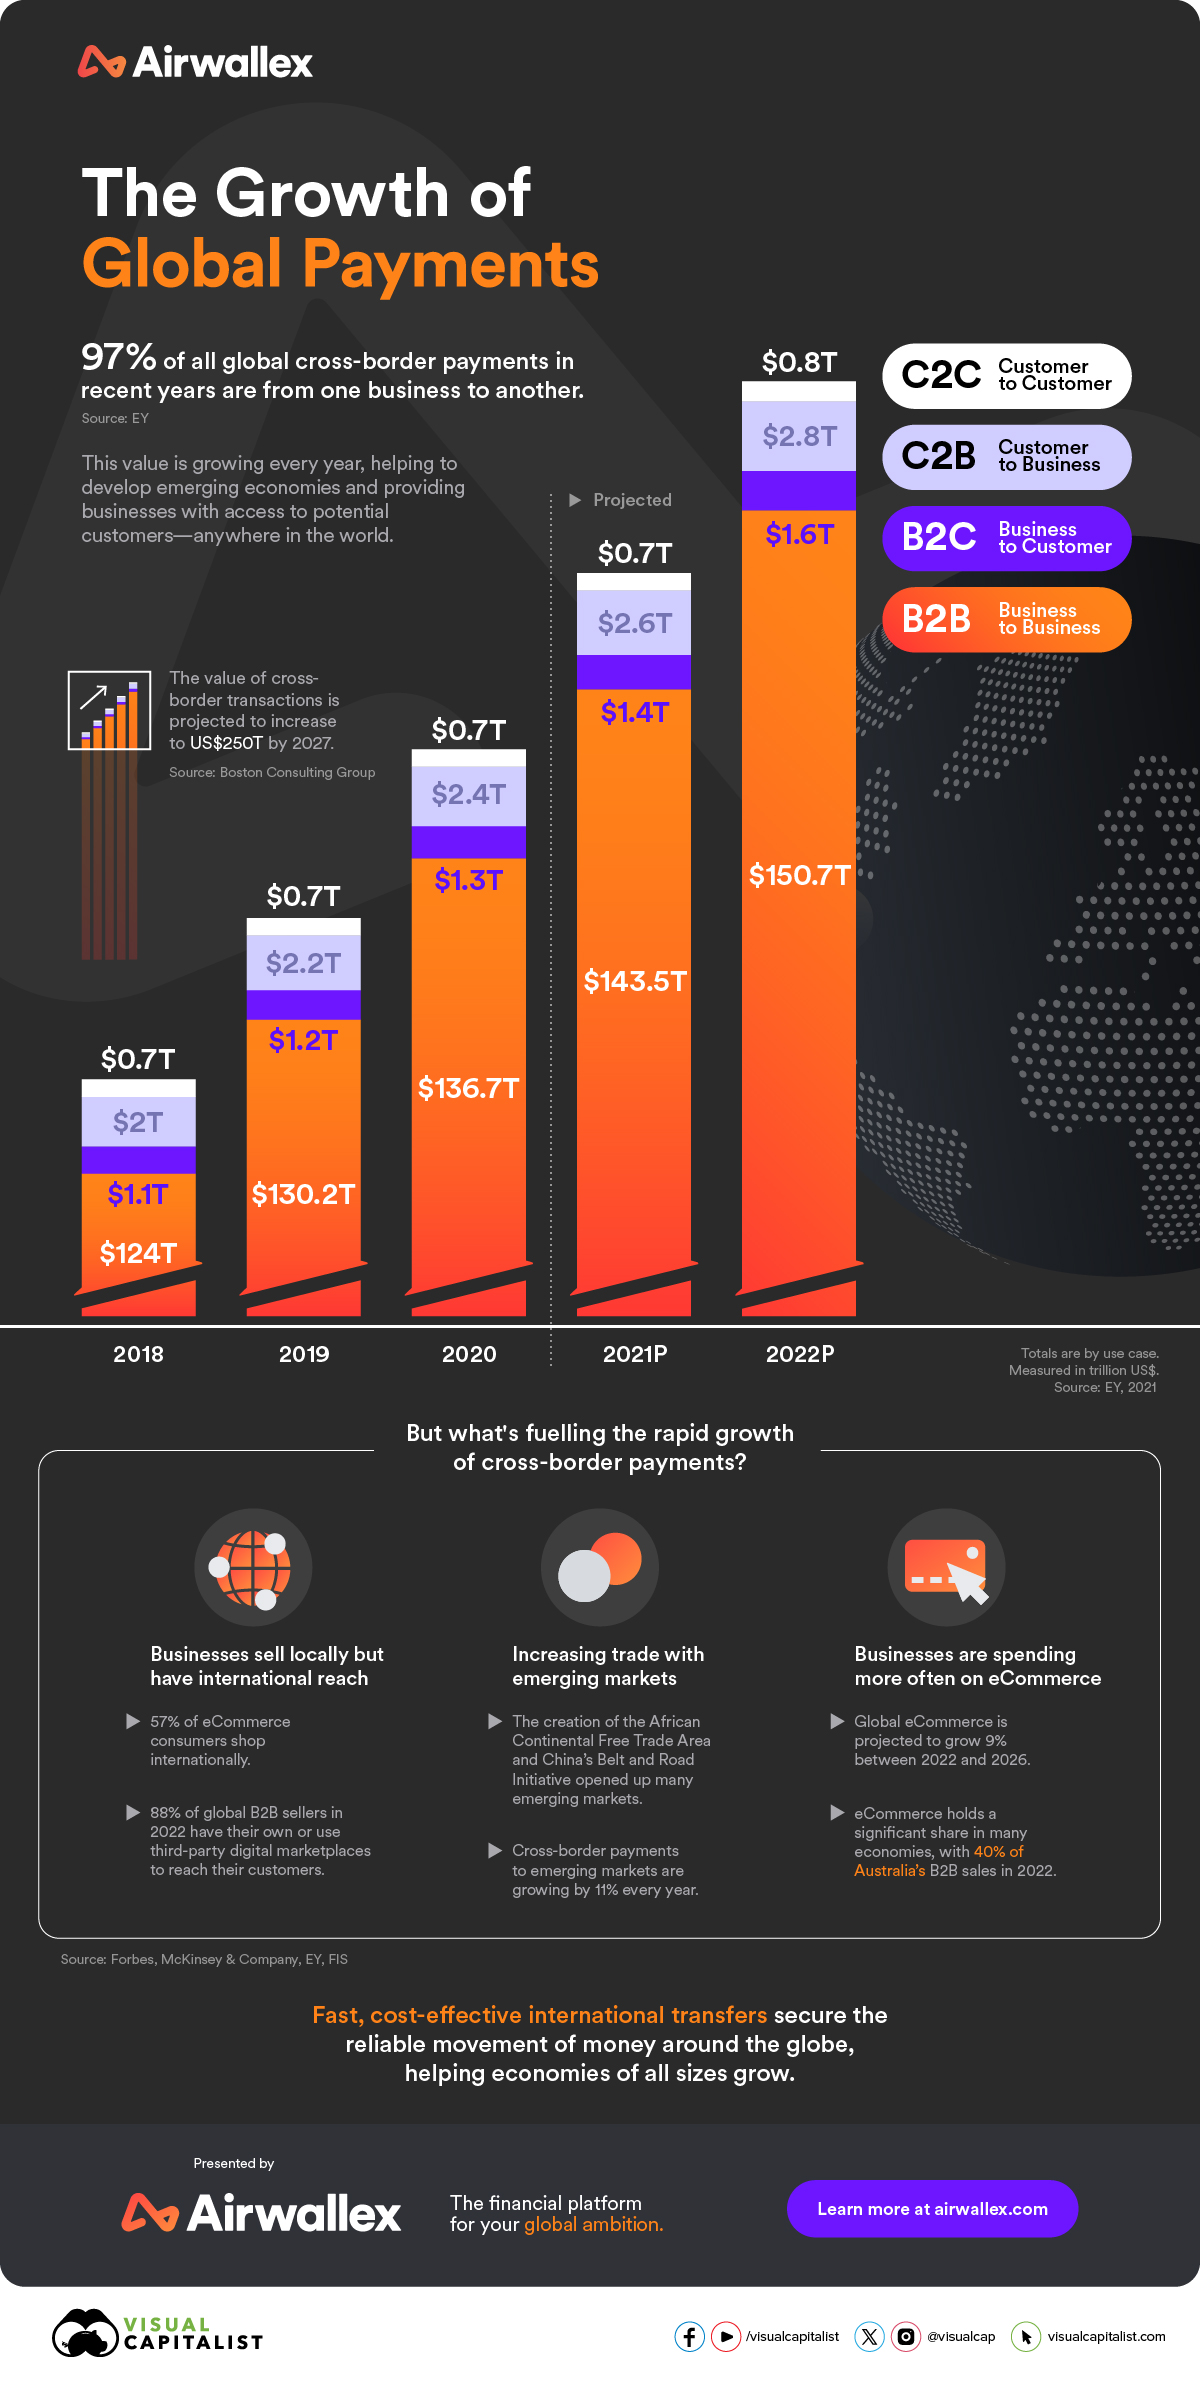
Between 2018 and 2022, the value of cross-border payments grew by over $25 trillion to reach over $150 trillion—nearly 30 times the size of the entire global technology industry in 2023.
For this graphic, we partnered with Airwallex to explore the growth of international payments and delve deeper into the forces driving this critical industry’s continued growth.
The Business of Cross-Border Payments
Business-to-business transactions fueled this incredible growth, comprising a staggering 97% of international payments’ total value:
| C2C (Trillion) | C2B (Trillion) | B2C (Trillion) | B2B (Trillion) | |
|---|---|---|---|---|
| 2018 | $0.7 | $2.0 | $1.1 | $124.0 |
| 2019 | $0.T | $2.2 | $1.2 | $130.2 |
| 2020 | $0.T | $2.4 | $1.3 | $136.7 |
| 2021p | $0.7 | $2.6 | $1.4 | $143.5 |
| 2022p | $0.8 | $2.8 | $1.6 | $150.7 |
But this is just the start. By 2027, international payments could grow by a further 60%. Meaning that over $250 trillion could be transferred across borders every year.
What is Driving Growth?
There are many reasons why the cross-border payment industry is growing. For one, many major economies are investing in trade and infrastructure projects like the African Continental Free Trade Area and China’s Belt and Road Initiative. These contribute over 10% of the annual growth in cross-border payments from emerging economies.
eCommerce also contributes significantly to the growth and overall sustainability of the international payment industry, with 57% of shoppers doing so internationally. Many regions are also seeing value in eCommerce and are prioritizing it in their sales strategies. For example, 40% of Australia’s 2022 B2B sales were through eCommerce.
Supporting Today’s Economy
Fast, inexpensive, and cashless payments help businesses grow and play a critical role in supporting the economy by facilitating eCommerce and trade all over the globe while promoting growth in developing economies.
Airwallex’s software and trusted APIs help over 100,000 businesses simplify global payments and promote growth without limitations.
Learn how seamless digital payments can improve your business at Airwallex.com

-

 Wealth23 hours ago
Charted: Which Country Has the Most Billionaires in 2024?
According to the annual Hurun Global Rich List, the U.S. and China are home to nearly half of the world’s 3,279 billionaires in 2024.
-

 Wealth4 days ago
Charted: Which City Has the Most Billionaires in 2024?
Just two countries account for half of the top 20 cities with the most billionaires. And the majority of the other half are found in Asia.
-

 Money6 days ago
Charted: Who Has Savings in This Economy?
Older, better-educated adults are winning the savings game, reveals a January survey by the National Opinion Research Center at the University of Chicago.
-

 Debt2 weeks ago
How Debt-to-GDP Ratios Have Changed Since 2000
See how much the debt-to-GDP ratios of advanced economies have grown (or shrank) since the year 2000.
-

 Demographics3 weeks ago
The Smallest Gender Wage Gaps in OECD Countries
Which OECD countries have the smallest gender wage gaps? We look at the 10 countries with gaps lower than the average.
-

 Money3 weeks ago
Which States Have the Highest Minimum Wage in America?
Here’s where workers earn the highest minimum wage in America as 22 states implement wage increases in 2024.