Energy
Ranked: Nuclear Power Production, by Country
![]() Subscribe to the Elements free mailing list for more like this
Subscribe to the Elements free mailing list for more like this
Nuclear Power Production by Country
This was originally posted on Elements. Sign up to the free mailing list to get beautiful visualizations on natural resource megatrends in your email every week.
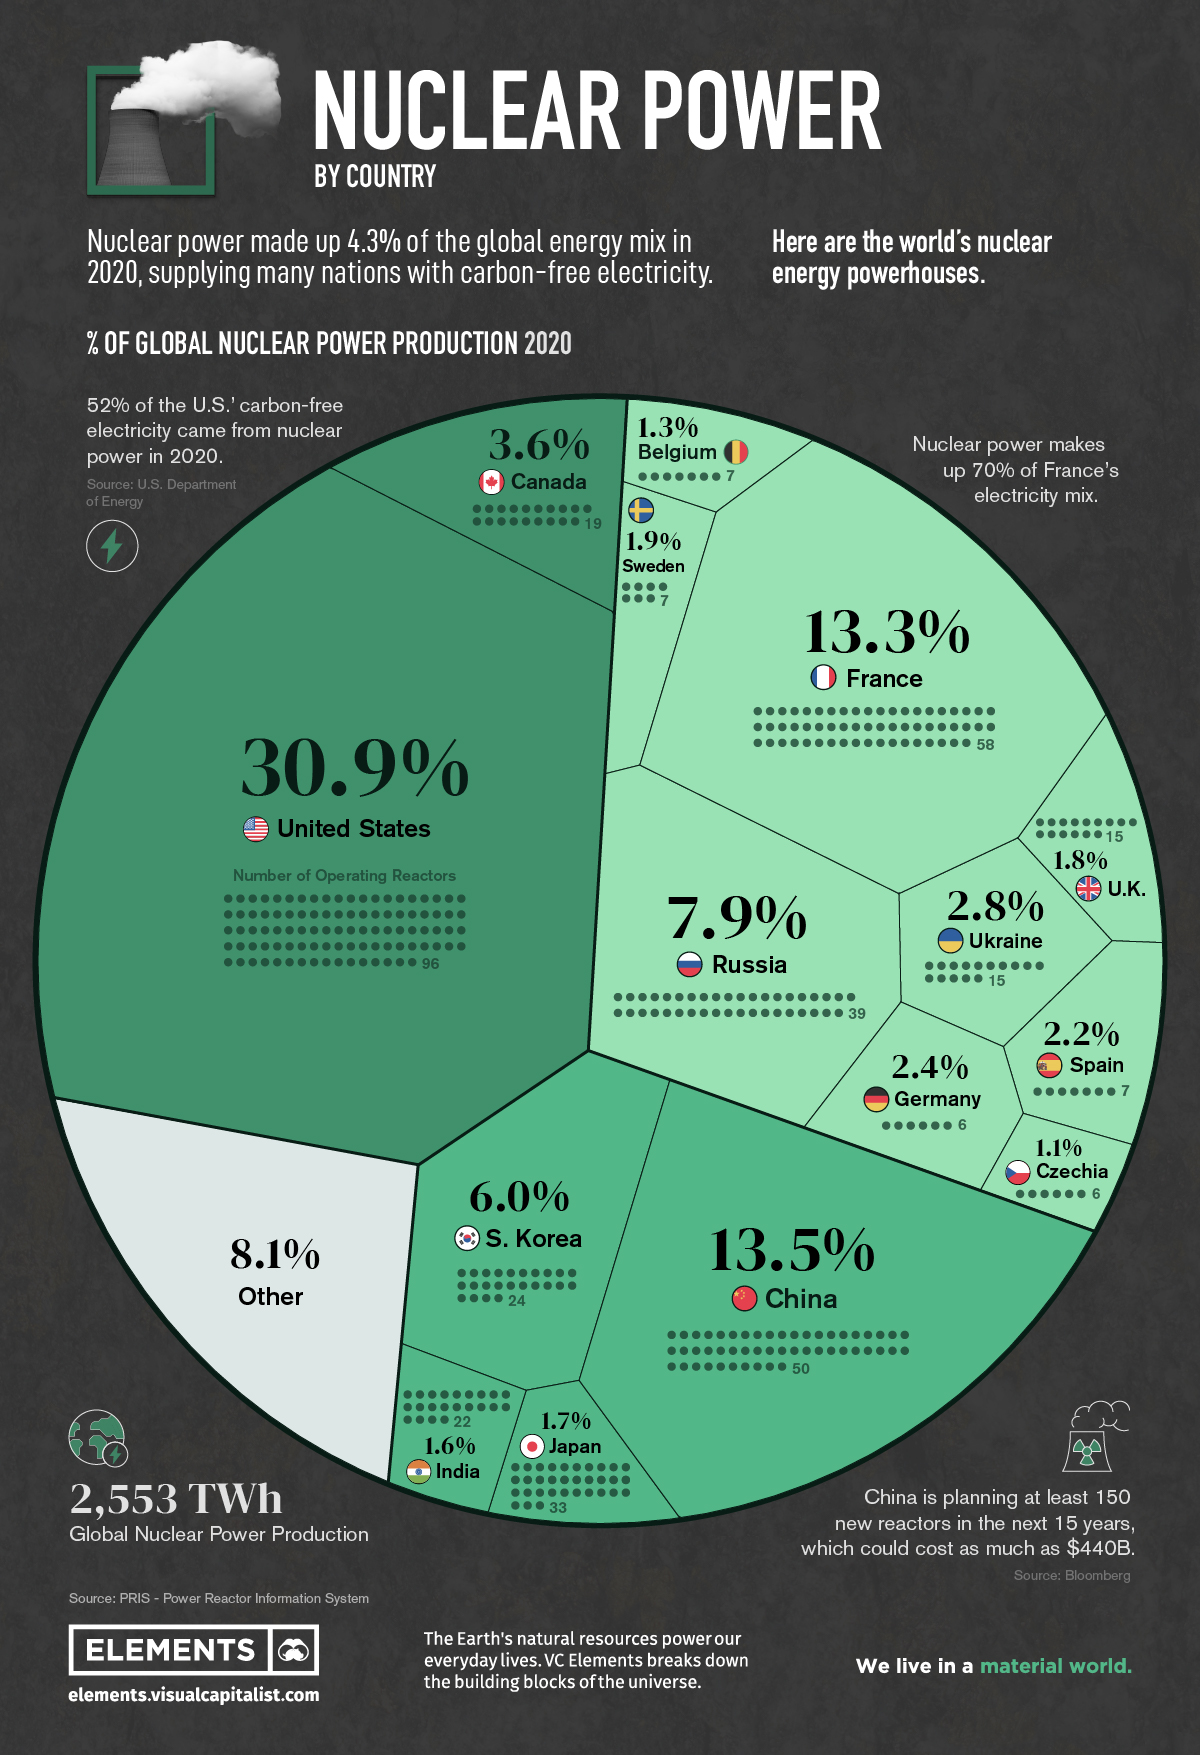
Nearly 450 reactors around the world supply various nations with nuclear power, combining for about 10% of the world’s electricity, or about 4% of the global energy mix.
But while some countries are turning to nuclear as a clean energy source, nuclear energy generation overall has seen a slowdown since its peak in the 1990s.
The above infographic breaks down nuclear electricity generation by country in 2020 using data from the Power Reactor Information System (PRIS).
Ranked: The Top 15 Countries for Nuclear Power
Just 15 countries account for more than 91% of global nuclear power production. Here’s how much energy these countries produced in 2020:
| Rank | Country | Number of Operating Reactors | Nuclear Electricity Supplied [GWh] | % share |
|---|---|---|---|---|
| #1 | U.S. 🇺🇸 | 96 | 789,919 | 30.9% |
| #2 | China 🇨🇳 | 50 | 344,748 | 13.5% |
| #3 | France 🇫🇷 | 58 | 338,671 | 13.3% |
| #4 | Russia 🇷🇺 | 39 | 201,821 | 7.9% |
| #5 | South Korea 🇰🇷 | 24 | 152,583 | 6.0% |
| #6 | Canada 🇨🇦 | 19 | 92,166 | 3.6% |
| #7 | Ukraine 🇺🇦 | 15 | 71,550 | 2.8% |
| #8 | Germany 🇩🇪 | 6 | 60,918 | 2.4% |
| #9 | Spain 🇪🇸 | 7 | 55,825 | 2.2% |
| #10 | Sweden 🇸🇪 | 7 | 47,362 | 1.9% |
| #11 | U.K. 🇬🇧 | 15 | 45,668 | 1.8% |
| #12 | Japan 🇯🇵 | 33 | 43,099 | 1.7% |
| #13 | India 🇮🇳 | 22 | 40,374 | 1.6% |
| #14 | Belgium 🇧🇪 | 7 | 32,793 | 1.3% |
| #15 | Czechia 🇨🇿 | 6 | 28,372 | 1.1% |
| Rest of the World 🌎 | 44 | 207,340 | 8.1% | |
| Total | 448 | 2,553,208 | 100.0% |
In the U.S., nuclear power produces over 50% of the country’s clean electricity. Additionally, 88 of the country’s 96 operating reactors in 2020 received approvals for a 20-year life extension.
China, the world’s second-largest nuclear power producer, is investing further in nuclear energy in a bid to achieve its climate goals. The plan, which includes building 150 new reactors by 2035, could cost as much as $440 billion.
On the other hand, European opinions on nuclear energy are mixed. Germany is the eighth-largest on the list but plans to shutter its last operating reactor in 2022 as part of its nuclear phase-out. France, meanwhile, plans to expand its nuclear capacity.
Which Countries Rely Most on Nuclear Energy?
Although total electricity generation is useful for a high-level global comparison, it’s important to remember that there are some smaller countries not featured above where nuclear is still an important part of the electricity mix.
Here’s a breakdown based on the share of nuclear energy in a country’s electricity mix:
| Rank | Country | Nuclear Share of Electricity Mix |
|---|---|---|
| #1 | France 🇫🇷 | 70.6% |
| #2 | Slovakia 🇸🇰 | 53.1% |
| #3 | Ukraine 🇺🇦 | 51.2% |
| #4 | Hungary 🇭🇺 | 48.0% |
| #5 | Bulgaria 🇧🇬 | 40.8% |
| #6 | Belgium 🇧🇪 | 39.1% |
| #7 | Slovenia 🇸🇮 | 37.8% |
| #8 | Czechia 🇨🇿 | 37.3% |
| #9 | Armenia 🇦🇲 | 34.5% |
| #10 | Finland 🇫🇮 | 33.9% |
| #11 | Switzerland 🇨🇭 | 32.9% |
| #12 | Sweden 🇸🇪 | 29.8% |
| #13 | South Korea 🇰🇷 | 29.6% |
| #14 | Spain 🇪🇸 | 22.2% |
| #15 | Russia 🇷🇺 | 20.6% |
| #16 | Romania 🇷🇴 | 19.9% |
| #17 | United States 🇺🇸 | 19.7% |
| #18 | Canada 🇨🇦 | 14.6% |
| #19 | United Kingdom 🇬🇧 | 14.5% |
| #20 | Germany 🇩🇪 | 11.3% |
European countries dominate the leaderboard with 14 of the top 15 spots, including France, where nuclear power is the country’s largest source of electricity.
It’s interesting to note that only a few of these countries are top producers of nuclear in absolute terms. For example, in Slovakia, nuclear makes up 53.6% of the electricity mix—however, the country’s four reactors make up less than 1% of total global operating capacity.
On the flipside, the U.S. ranks 17th by share of nuclear power in its mix, despite producing 31% of global nuclear electricity in 2020. This discrepancy is largely due to size and population. European countries are much smaller and produce less electricity overall than larger countries like the U.S. and China.
The Future of Nuclear Power
The nuclear power landscape is constantly changing.
There were over 50 additional nuclear reactors under construction in 2020, and hundreds more are planned primarily in Asia.
As countries turn away from fossil fuels and embrace carbon-free energy sources, nuclear energy might see a resurgence in the global energy mix despite the phase-outs planned in several countries around the globe.


Who’s Building the Most Solar Energy?
This was originally posted on our Voronoi app. Download the app for free on iOS or Android and discover incredible data-driven charts from a variety of trusted sources.
In 2023, solar energy accounted for three-quarters of renewable capacity additions worldwide. Most of this growth occurred in Asia, the EU, and the U.S., continuing a trend observed over the past decade.
In this graphic, we illustrate the rise in installed solar photovoltaic (PV) capacity in China, the EU, and the U.S. between 2010 and 2022, measured in gigawatts (GW). Bruegel compiled the data..
Chinese Dominance
As of 2022, China’s total installed capacity stands at 393 GW, nearly double that of the EU’s 205 GW and surpassing the USA’s total of 113 GW by more than threefold in absolute terms.
| Installed solar capacity (GW) | China | EU27 | U.S. |
|---|---|---|---|
| 2022 | 393.0 | 205.5 | 113.0 |
| 2021 | 307.0 | 162.7 | 95.4 |
| 2020 | 254.0 | 136.9 | 76.4 |
| 2019 | 205.0 | 120.1 | 61.6 |
| 2018 | 175.3 | 104.0 | 52.0 |
| 2017 | 130.8 | 96.2 | 43.8 |
| 2016 | 77.8 | 91.5 | 35.4 |
| 2015 | 43.6 | 87.7 | 24.2 |
| 2014 | 28.4 | 83.6 | 18.1 |
| 2013 | 17.8 | 79.7 | 13.3 |
| 2012 | 6.7 | 71.1 | 8.6 |
| 2011 | 3.1 | 53.3 | 5.6 |
| 2010 | 1.0 | 30.6 | 3.4 |
Since 2017, China has shown a compound annual growth rate (CAGR) of approximately 25% in installed PV capacity, while the USA has seen a CAGR of 21%, and the EU of 16%.
Additionally, China dominates the production of solar power components, currently controlling around 80% of the world’s solar panel supply chain.
In 2022, China’s solar industry employed 2.76 million individuals, with manufacturing roles representing approximately 1.8 million and the remaining 918,000 jobs in construction, installation, and operations and maintenance.
The EU industry employed 648,000 individuals, while the U.S. reached 264,000 jobs.
According to the IEA, China accounts for almost 60% of new renewable capacity expected to become operational globally by 2028.
Despite the phasing out of national subsidies in 2020 and 2021, deployment of solar PV in China is accelerating. The country is expected to reach its national 2030 target for wind and solar PV installations in 2024, six years ahead of schedule.

-

 Markets6 days ago
The World’s Fastest Growing Emerging Markets (2024-2029 Forecast)
-

 Technology2 weeks ago
All of the Grants Given by the U.S. CHIPS Act
-

 Green2 weeks ago
The Carbon Footprint of Major Travel Methods
-

 United States2 weeks ago
Visualizing the Most Common Pets in the U.S.
-

 Culture2 weeks ago
The World’s Top Media Franchises by All-Time Revenue
-

 Visual Capitalist1 week ago
Best Visualizations of April on the Voronoi App
-

 Wealth1 week ago
Charted: Which Country Has the Most Billionaires in 2024?
-

 Markets1 week ago
The Top Private Equity Firms by Country