Mapped: Europe’s GDP Per Capita, by Country
The Growth of a $1,000 Equity Investment, by Stock Market
Mapped: The Most Valuable Company in Each Southeast Asian Country
Visualizing Global Inflation Forecasts (2024-2026)
The World’s Fastest Growing Emerging Markets (2024-2029 Forecast)
Countries With the Highest Rates of Crypto Ownership
Mapped: The Number of AI Startups By Country
All of the Grants Given by the U.S. CHIPS Act
Visualizing AI Patents by Country
How Tech Logos Have Evolved Over Time
Visualizing the Tax Burden of Every U.S. State
Charted: What Frustrates Americans About the Tax System
Ranked: The Top 20 Countries in Debt to China
Charted: Which Country Has the Most Billionaires in 2024?
Charted: Which City Has the Most Billionaires in 2024?
Mapped: Countries Where Recreational Cannabis is Legal
Which Countries Have the Highest Infant Mortality Rates?
Life Expectancy by Region (1950-2050F)
What Causes Preventable Child Deaths?
The Cost of an EpiPen in Major Markets
Who’s Building the Most Solar Energy?
Mapped: The Age of Energy Projects in Interconnection Queues, by State
Ranked: The Top 10 EV Battery Manufacturers in 2023
The World’s Biggest Nuclear Energy Producers
The World’s Biggest Oil Producers in 2023
Mapped: U.S. Immigrants by Region
Mapped: Southeast Asia’s GDP Per Capita, by Country
The Largest Earthquakes in the New York Area (1970-2024)
Mapped: Average Wages Across Europe
Visualizing Copper Production by Country in 2023
Where the World’s Aluminum is Smelted, by Country
Visualizing Global Gold Production in 2023
Gold vs. S&P 500: Which Has Grown More Over Five Years?
How People Get Around in America, Europe, and Asia
The Carbon Footprint of Major Travel Methods
Ranking the Top 15 Countries by Carbon Tax Revenue
Ranked: The Countries With the Most Air Pollution in 2023
Top Countries By Forest Growth Since 2001
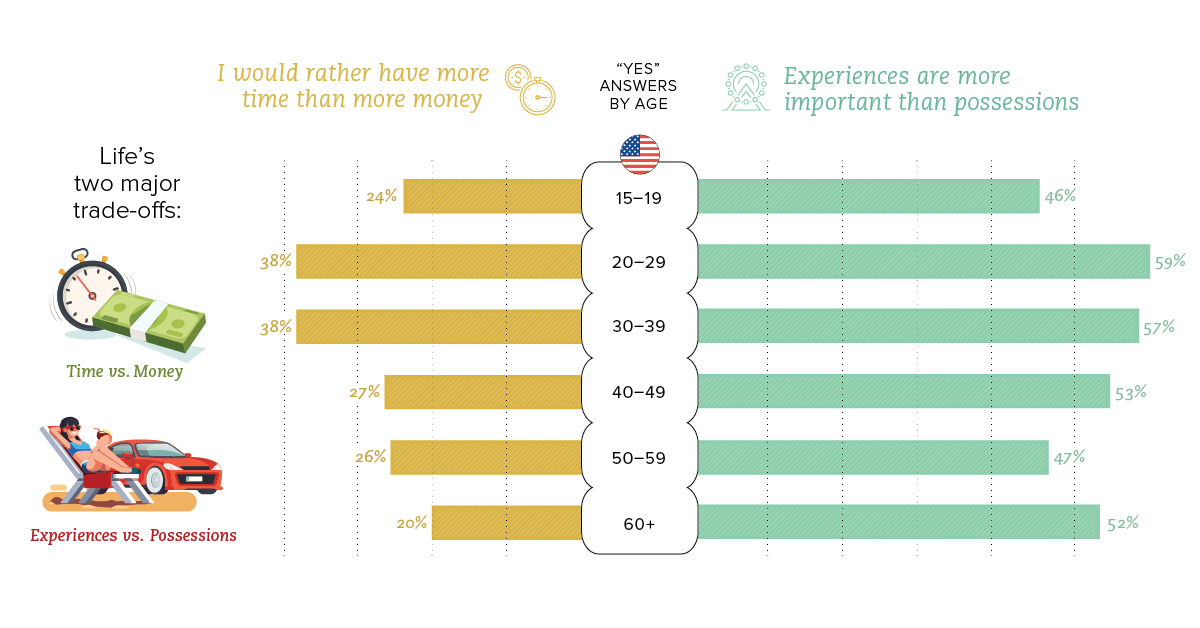
We look at how the trade-off of time and money is viewed between different generations, as well as the international differences between countries.
The third infographic in our Rise of Tesla Series showcases Musk's ambitious vision for the future of Tesla, along with the products that will make it...
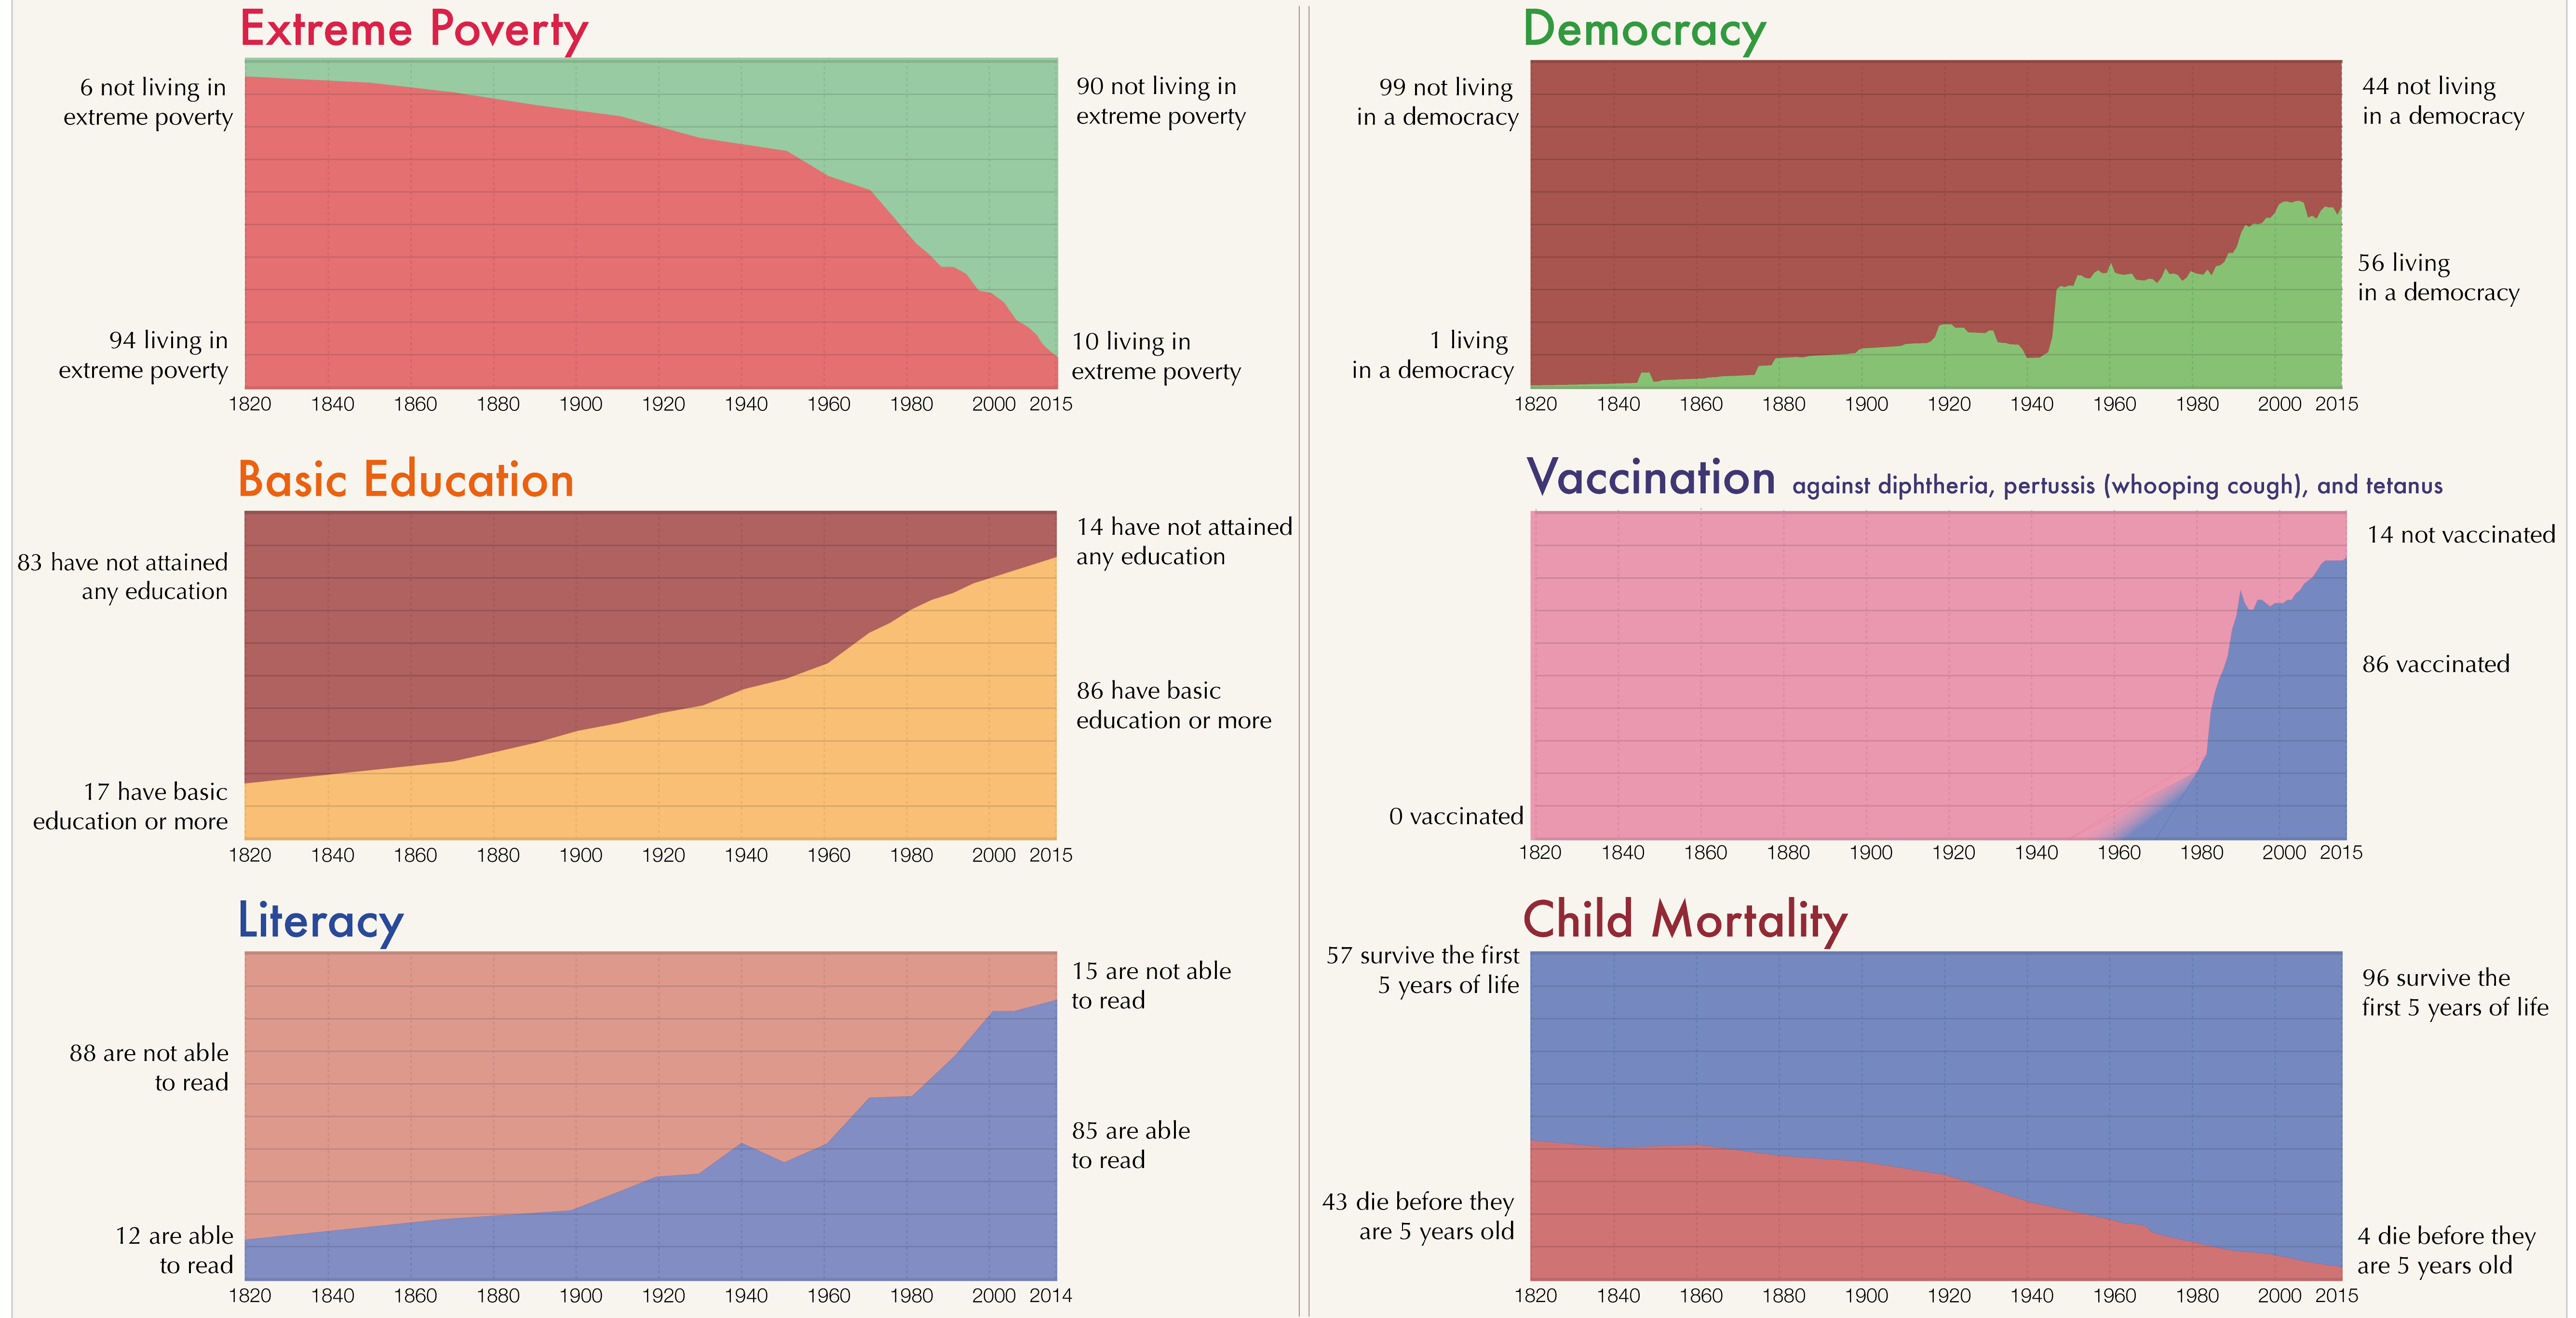
Long-term trends really allow you to see human progress on the most important indicators, like poverty reduction, education, democracy, literacy, and health.
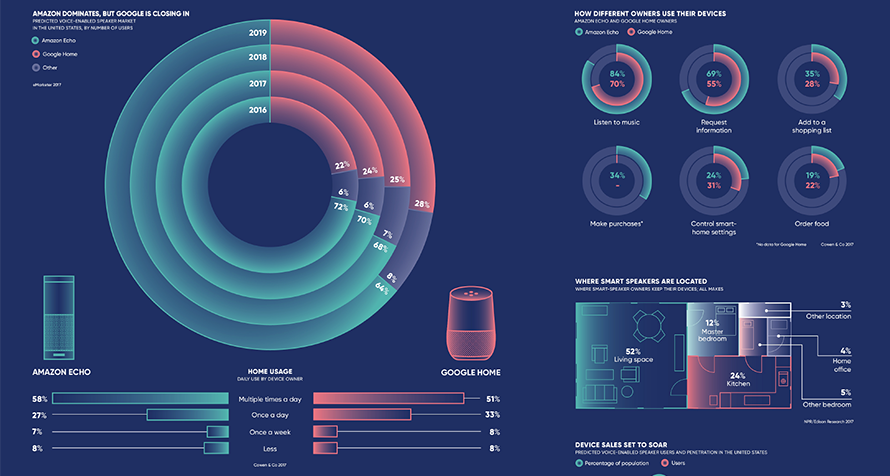
The growing array of AI-powered 'smart speakers' on the market points to a larger consumer shift. Here's what you need to know.
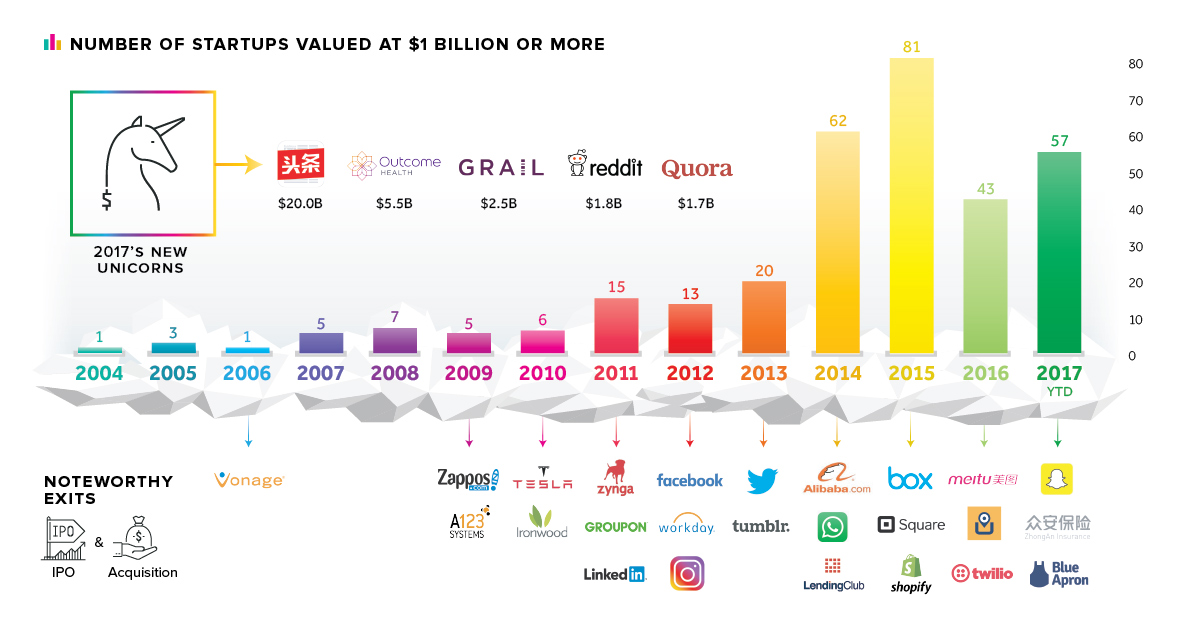
Total new unicorns in 2017 is down from its frothy peak - but this year brings several interesting new entrants, like China's Toutiao, valued at a...
By the end of 2017, it's estimated that 16.3% of Americans will live in smart homes, and this percentage will increase to 35.6% by 2021.
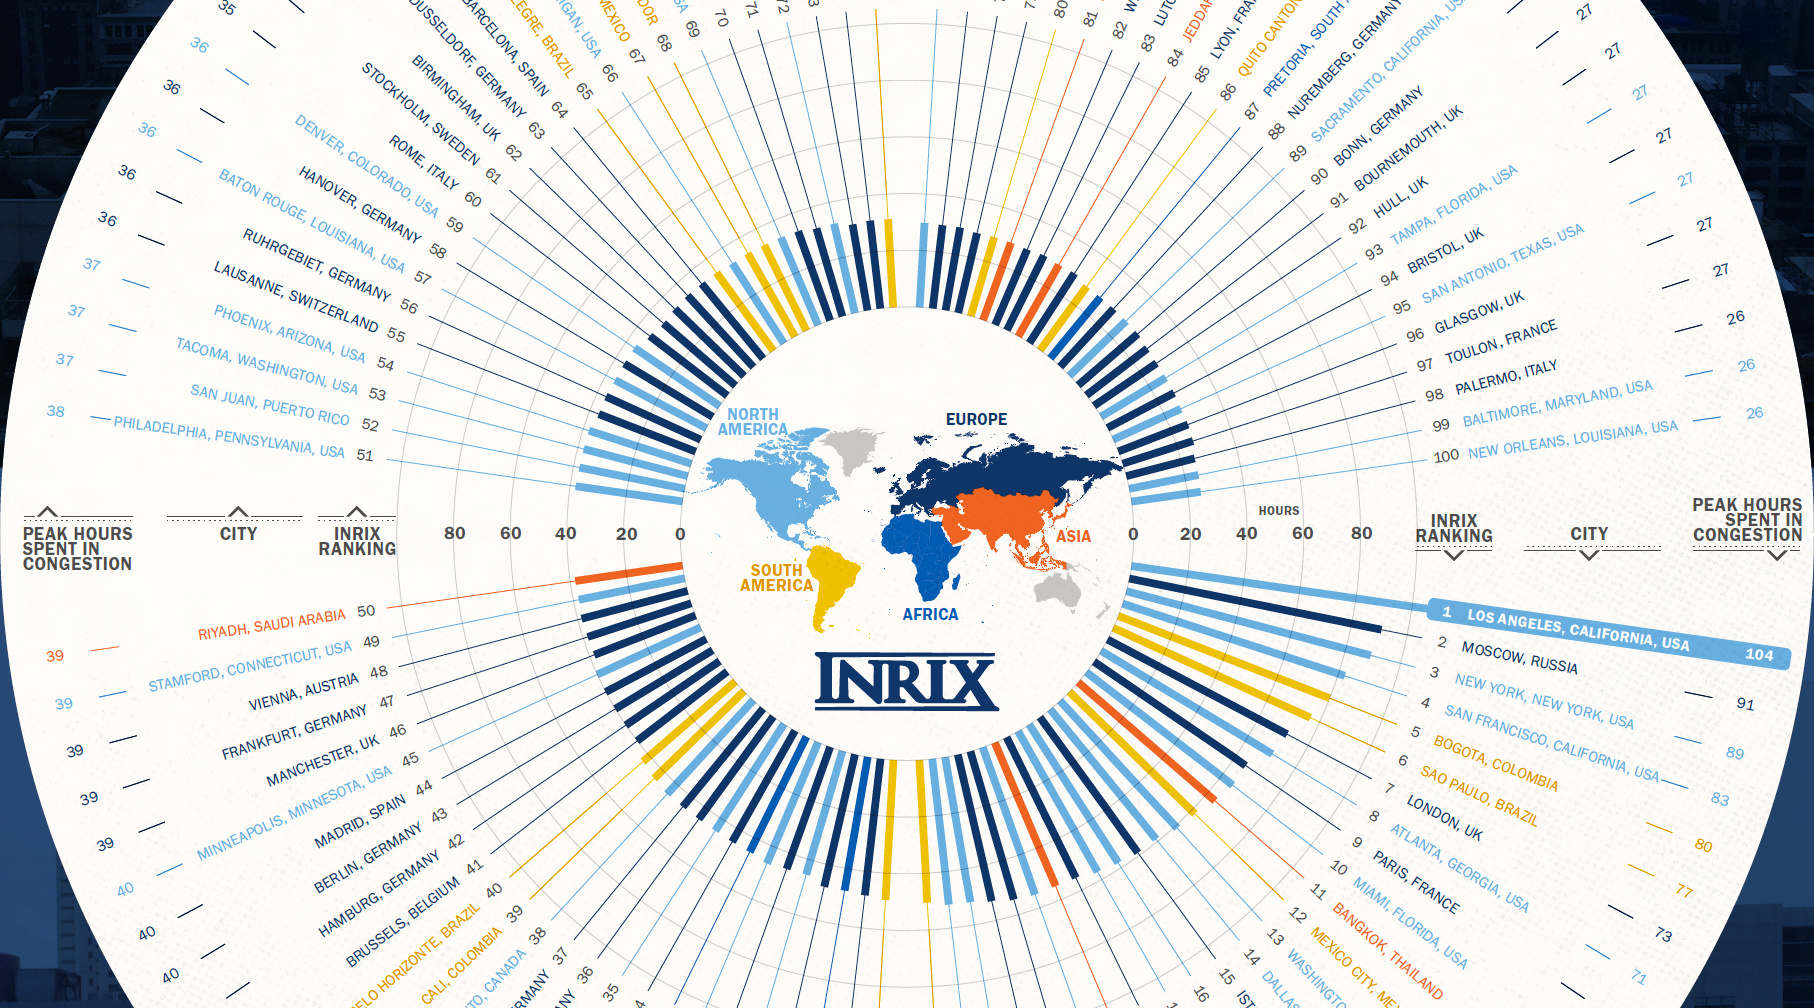
Which city has the ultimate distinction of having the world's most horrific traffic? See this infographic to see the most congested cities globally.
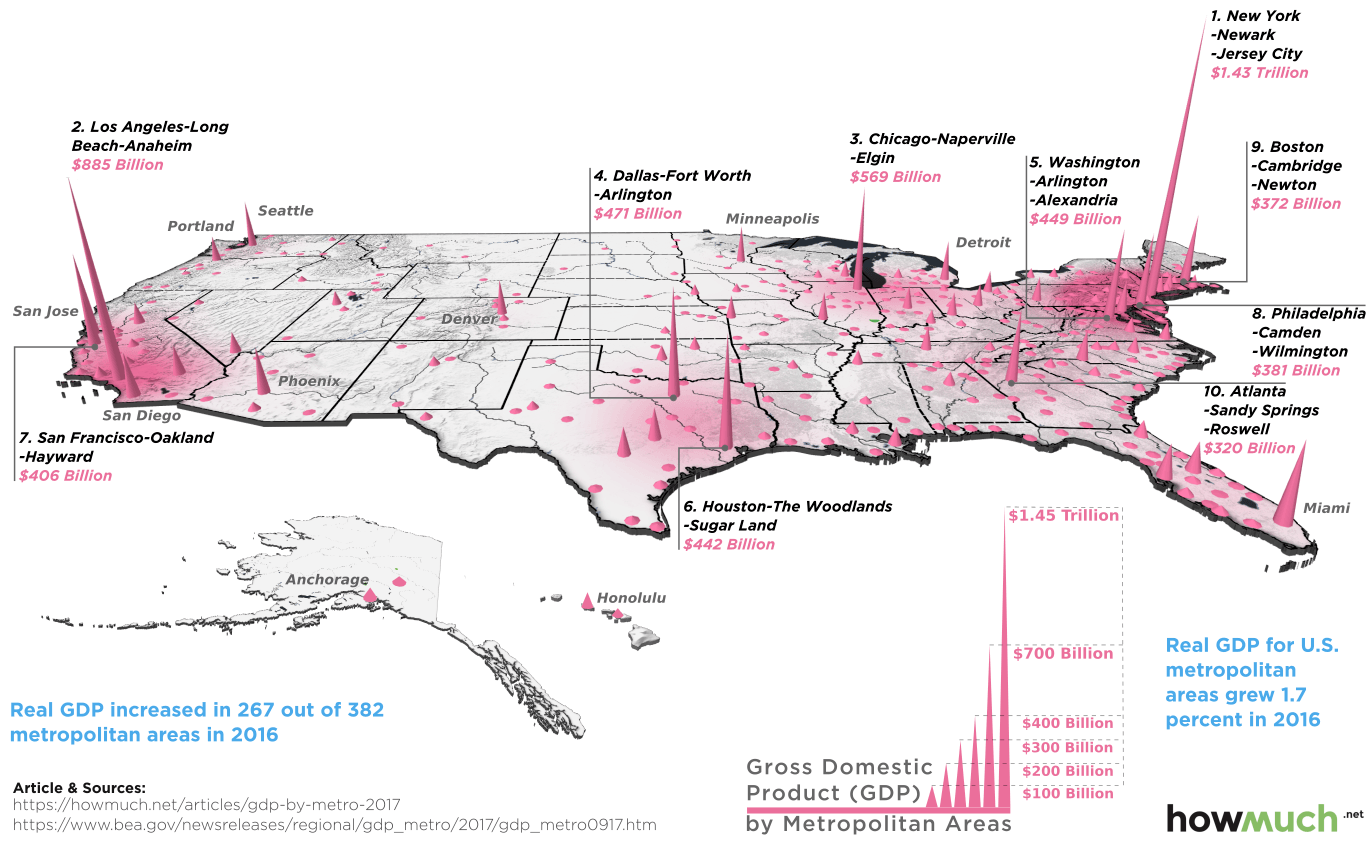
Which cities have the highest economic production in the country? This 3d map highlights GDP by metro area based on recent data.
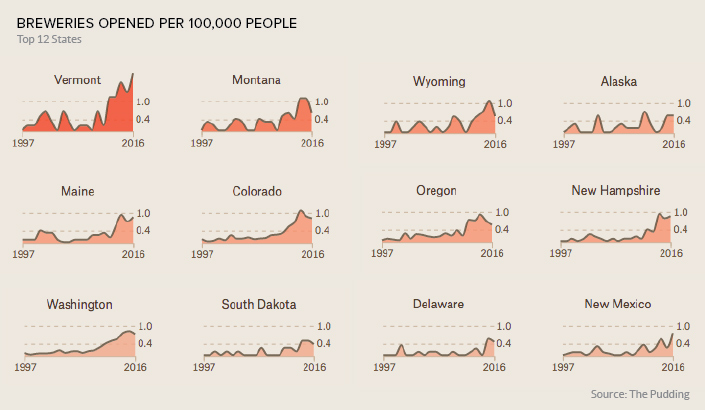
The craft beer boom is a nation-wide trend, but certain cities have an outsize influence on the industry - and beer lovers.
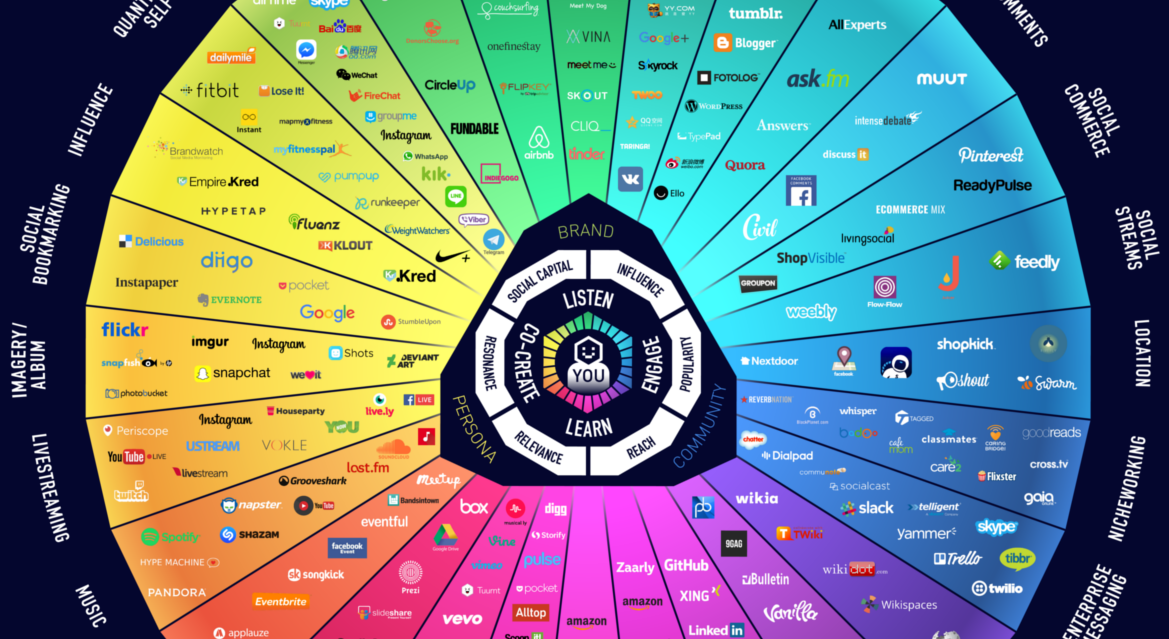
Explore the massive social media ecosystem of 2017 with this infographic, as well as how things have changed over the last 10 years.