Money
How Different Age Groups View the Trade-Off Between Time and Money
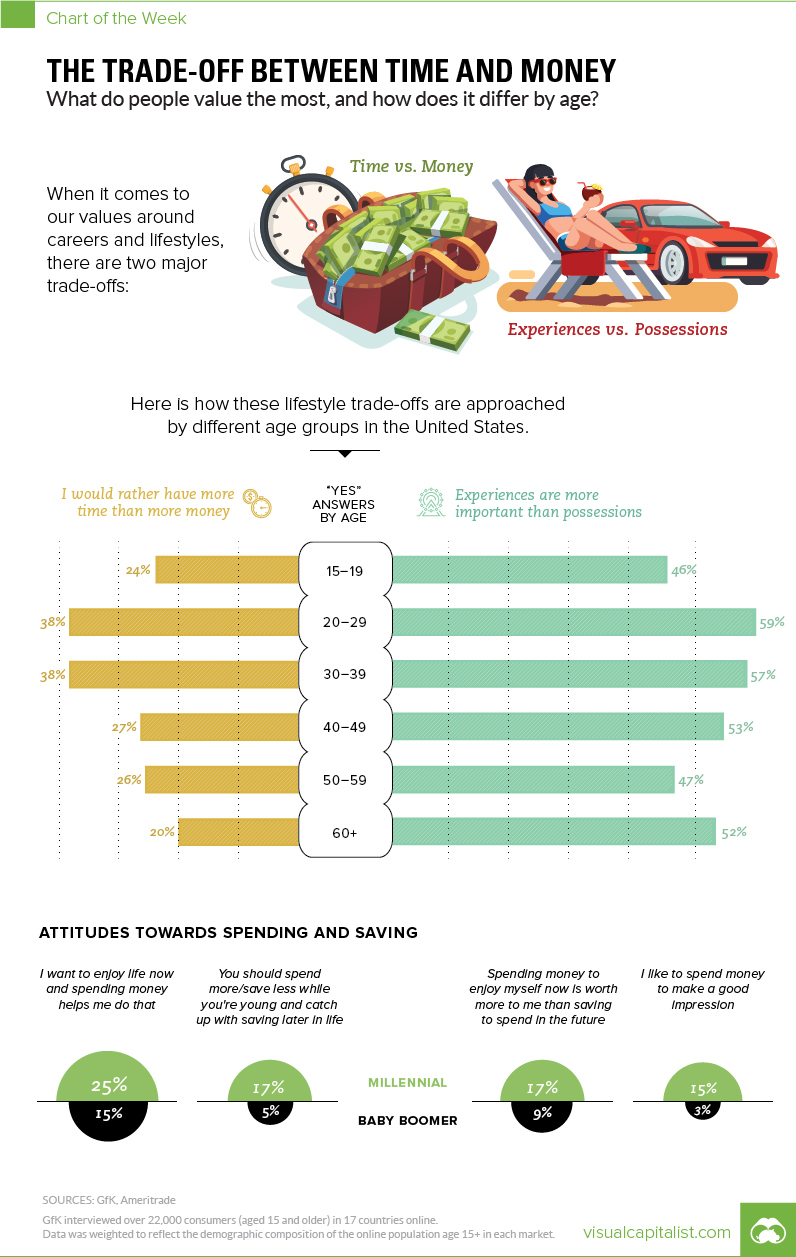
The Trade-Off Between Time and Money
The Chart of the Week is a weekly Visual Capitalist feature on Fridays.
Every individual person has their own unique set of values when it comes to how they approach their lifestyle and career.
Generally speaking, however, most people have a viewpoint on the inherent trade-off between time and money, as well as whether these precious resources should be used to seek out experiences or buy possessions.
Today’s chart uses data from a global survey of 22,000 internet users in 17 different countries by GfK Global, which gave people the option to choose whether they valued:
- Time vs. Money
- Experiences vs. Possessions
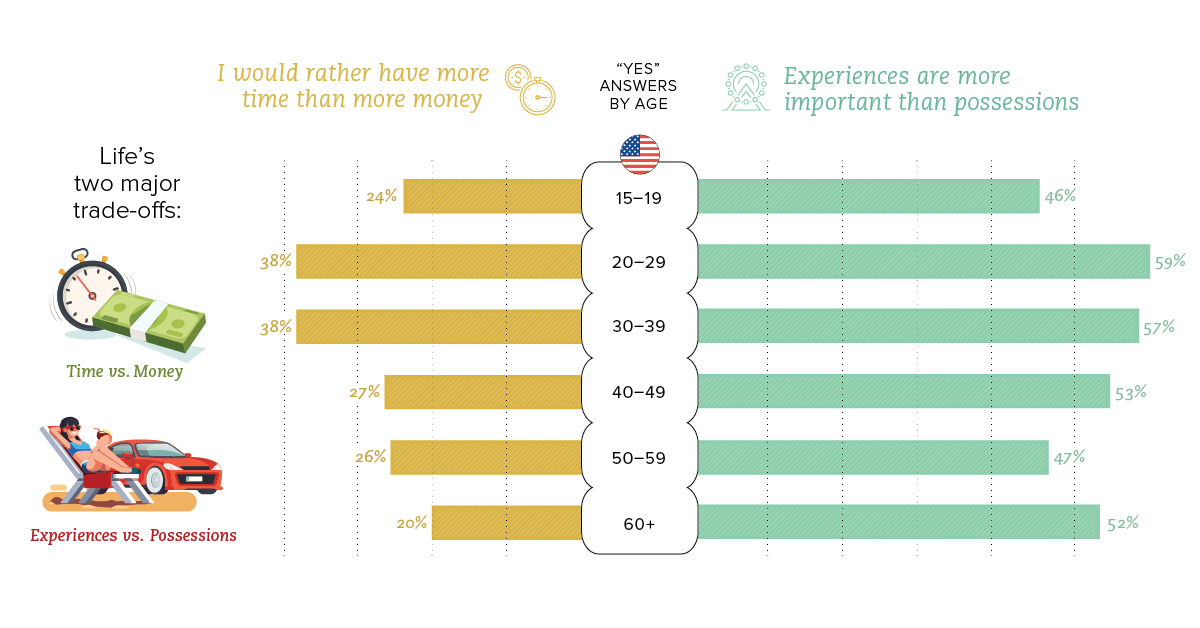
We’ll first look at the U.S. data with a focus on generational differences, and then we’ll present the international data on how this trade-off between time and money manifests itself between countries.
Generational Differences
Judging by age alone, one might guess that younger generations would prefer to “take the money and run”. After all, millennials are often stereotyped as a cash-strapped generation.
Interestingly, this doesn’t seem to be the case at all, at least according to U.S. data:
| Age Group | Time > Money (% agree) | Experiences > Possessions (% agree) |
|---|---|---|
| 15-19 years | 24% | 46% |
| 20-29 years | 38% | 59% |
| 30-39 years | 38% | 57% |
| 40-49 years | 27% | 53% |
| 50-59 years | 26% | 47% |
| 60+ years | 20% | 52% |
When it comes to time and money, 38% of both the 20-29 year and 30-39 year ranges prefer to choose time over money. This is a significantly higher portion than those of other age groups. Surprisingly, only 20% of people in the 60+ group clearly had a preference for time over money.
As for experiences and possessions, it was a similar case, with the 20-29 year and 30-39 year groups having the highest preference for experiences. This is not surprising, and it’s a widely known millennial attribute to seek powerful experiences like travel, music festivals, sports, and live events over buying new material possessions such as furniture or a new car.
International Differences
How do people from different countries approach the same survey questions?
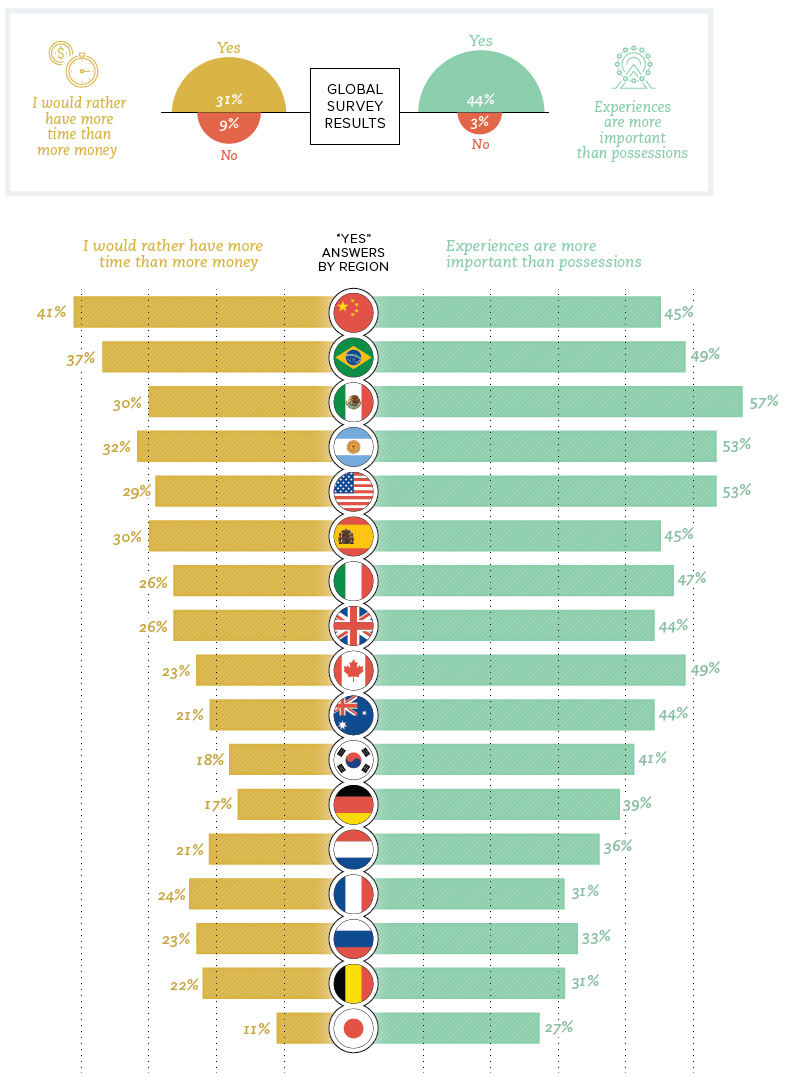
The international chart reveals some interesting differences about the perceived value of time and money.
One very stark one lies between two Asian nations in close proximity. Folks surveyed from China had the highest preference for time over money (41% agreeing), while across the East China Sea, in Japan, the results show the lowest preference for time over money (11% agreeing).
Another interesting cultural difference: countries in Latin America tend to see experiences as far more important than the rest of the globe. Mexico (57%), Argentina (53%), and Brazil (49%) all were well above the global average of 44% for choosing experiences over possessions.


Demographics
The Smallest Gender Wage Gaps in OECD Countries
Which OECD countries have the smallest gender wage gaps? We look at the 10 countries with gaps lower than the average.


The Smallest Gender Pay Gaps in OECD Countries
This was originally posted on our Voronoi app. Download the app for free on iOS or Android and discover incredible data-driven charts from a variety of trusted sources.
Among the 38 member countries in the Organization for Economic Cooperation and Development (OECD), several have made significant strides in addressing income inequality between men and women.
In this graphic we’ve ranked the OECD countries with the 10 smallest gender pay gaps, using the latest data from the OECD for 2022.
The gender pay gap is calculated as the difference between median full-time earnings for men and women divided by the median full-time earnings of men.
Which Countries Have the Smallest Gender Pay Gaps?
Luxembourg’s gender pay gap is the lowest among OECD members at only 0.4%—well below the OECD average of 11.6%.
| Rank | Country | Percentage Difference in Men's & Women's Full-time Earnings |
|---|---|---|
| 1 | 🇱🇺 Luxembourg | 0.4% |
| 2 | 🇧🇪 Belgium | 1.1% |
| 3 | 🇨🇷 Costa Rica | 1.4% |
| 4 | 🇨🇴 Colombia | 1.9% |
| 5 | 🇮🇪 Ireland | 2.0% |
| 6 | 🇭🇷 Croatia | 3.2% |
| 7 | 🇮🇹 Italy | 3.3% |
| 8 | 🇳🇴 Norway | 4.5% |
| 9 | 🇩🇰 Denmark | 5.8% |
| 10 | 🇵🇹 Portugal | 6.1% |
| OECD Average | 11.6% |
Notably, eight of the top 10 countries with the smallest gender pay gaps are located in Europe, as labor equality laws designed to target gender differences have begun to pay off.
The two other countries that made the list were Costa Rica (1.4%) and Colombia (1.9%), which came in third and fourth place, respectively.
How Did Luxembourg (Nearly) Eliminate its Gender Wage Gap?
Luxembourg’s virtually-non-existent gender wage gap in 2020 can be traced back to its diligent efforts to prioritize equal pay. Since 2016, firms that have not complied with the Labor Code’s equal pay laws have been subjected to penalizing fines ranging from €251 to €25,000.
Higher female education rates also contribute to the diminishing pay gap, with Luxembourg tied for first in the educational attainment rankings of the World Economic Forum’s Global Gender Gap Index Report for 2023.
See More Graphics about Demographics and Money
While these 10 countries are well below the OECD’s average gender pay gap of 11.6%, many OECD member countries including the U.S. are significantly above the average. To see the full list of the top 10 OECD countries with the largest gender pay gaps, check out this visualization.

-

 Business2 weeks ago
America’s Top Companies by Revenue (1994 vs. 2023)
-

 Environment1 week ago
Ranked: Top Countries by Total Forest Loss Since 2001
-

 Markets2 weeks ago
Visualizing America’s Shortage of Affordable Homes
-

 Maps2 weeks ago
Mapped: Average Wages Across Europe
-

 Mining2 weeks ago
Charted: The Value Gap Between the Gold Price and Gold Miners
-

 Demographics2 weeks ago
Visualizing the Size of the Global Senior Population
-

 Misc2 weeks ago
Tesla Is Once Again the World’s Best-Selling EV Company
-

 Technology2 weeks ago
Ranked: The Most Popular Smartphone Brands in the U.S.