Misc
Which Cities are Fueling America’s Craft Beer Boom?
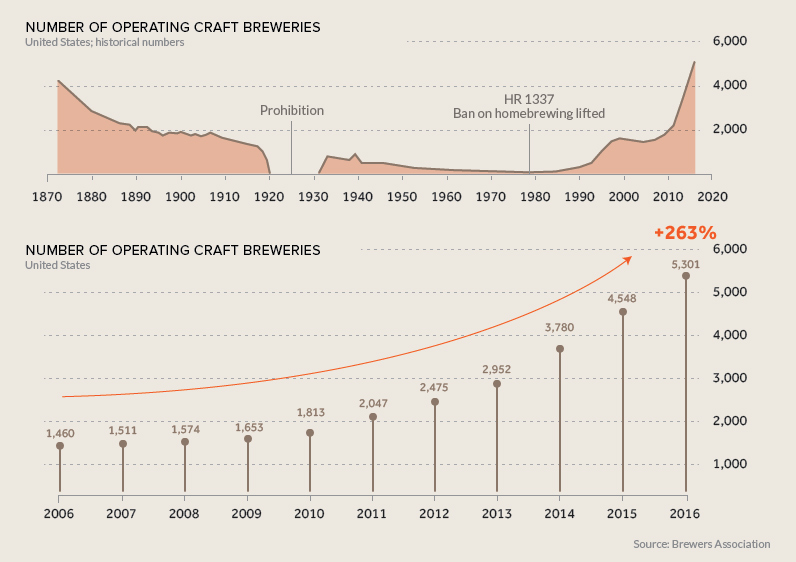
The craft beer industry in the United States has been a bright spot of the economy for nearly a decade.
With an economic impact of $23.5 billion and the number of operating breweries in the U.S. totaling well over 5,000 today, the industry is clearly past the point of being a millennial fad. There are more choices available than ever before, and this appears to signal a broader shift in consumer preference.
Below is a look at both historical and recent craft beer industry numbers:
Mapping Craft Beer Hubs
The craft beer boom is a nation-wide trend, but there are certain cities that have an outsize influence on the industry both in volume and reputation. Recently, The Pudding’s Russell Goldenberg looked to answer the question: which city is the microbrew capital of the U.S.?
Goldenberg looks at both quality of beer (based on user ratings), as well as the quantity of nearby breweries as criteria. Below are the Top 10 cities based on equal weights for both categories, with an end result that may be unexpected for some.
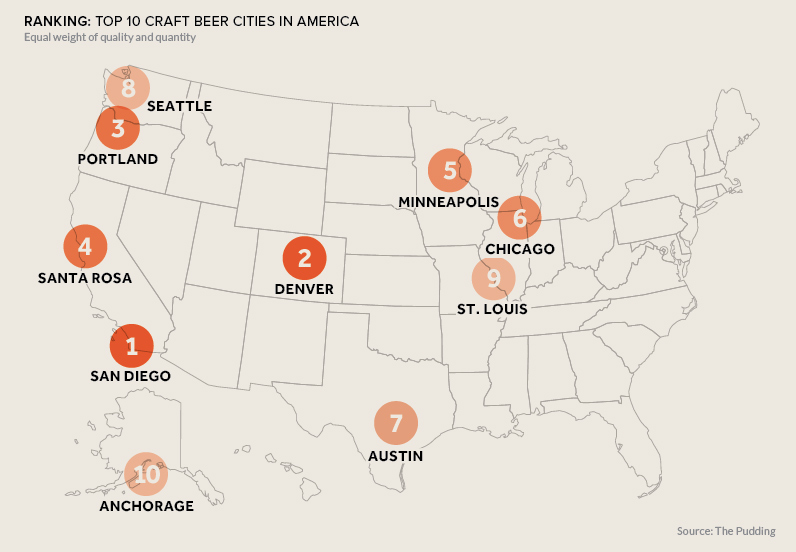
Extremely high user ratings helped power mid-sized cities like Santa Rosa and Anchorage up the rankings. The offerings in these places, such as Russian River Brewing and Midnight Sun Brewing Company, are among the top rated brewers in the country, setting a high bar for quality.
However, in terms of the pure quantity of breweries, cities like Denver, Portland, and San Diego can’t be beat. The Denver “Beer Triangle” has over 72 breweries alone, while Portland is a regular destination for beer lovers from all over the continent.
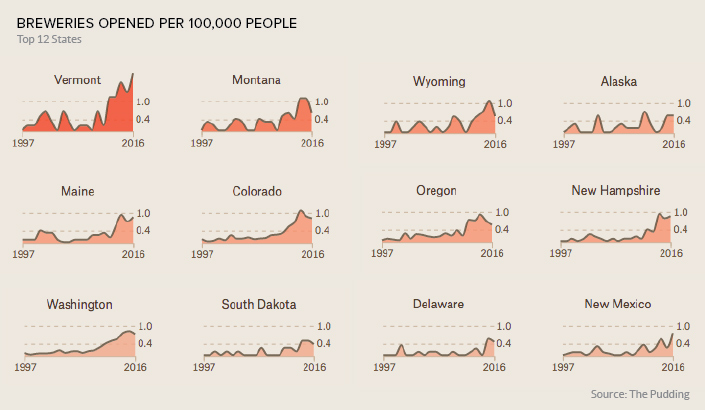
New Breweries Per Capita
Looking at the state level, per capita data paints an interesting picture of where craft beer hot spots are beginning to emerge:
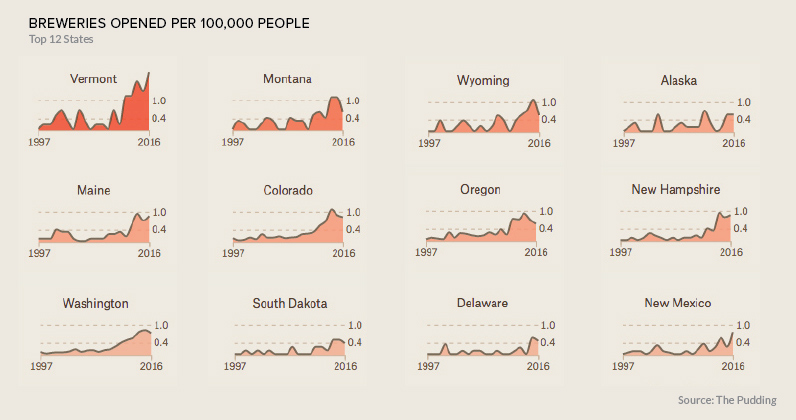
Browse the full list here.
Most notably, Vermont is wild about craft beer, though their industry is more uniformly spread throughout the state (as opposed to clustered in a single city). A recent count shows 68 active breweries in a state with just 625,000 in population – a very impressive beer-to-drinker ratio.
Bubble Brewing?
Will the craft beer boom continue, or is there already too much froth in some cities?
Currently, 75% of Americans live within 10 miles of a brewery, but there are still plenty of population centers that could support a local brewery. Savvy marketing, unique offerings, and millennial preferences for local products may continue to push the craft brew trend into new parts of the country, so this will be an interesting list to revisit in a few years.


Misc
How Hard Is It to Get Into an Ivy League School?
We detail the admission rates and average annual cost for Ivy League schools, as well as the median SAT scores required to be accepted.


How Hard Is It to Get Into an Ivy League School?
This was originally posted on our Voronoi app. Download the app for free on iOS or Android and discover incredible data-driven charts from a variety of trusted sources.
Ivy League institutions are renowned worldwide for their academic excellence and long-standing traditions. But how hard is it to get into one of the top universities in the U.S.?
In this graphic, we detail the admission rates and average annual cost for Ivy League schools, as well as the median SAT scores required to be accepted. The data comes from the National Center for Education Statistics and was compiled by 24/7 Wall St.
Note that “average annual cost” represents the net price a student pays after subtracting the average value of grants and/or scholarships received.
Harvard is the Most Selective
The SAT is a standardized test commonly used for college admissions in the United States. It’s taken by high school juniors and seniors to assess their readiness for college-level academic work.
When comparing SAT scores, Harvard and Dartmouth are among the most challenging universities to gain admission to. The median SAT scores for their students are 760 for reading and writing and 790 for math. Still, Harvard has half the admission rate (3.2%) compared to Dartmouth (6.4%).
| School | Admission rate (%) | SAT Score: Reading & Writing | SAT Score: Math | Avg Annual Cost* |
|---|---|---|---|---|
| Harvard University | 3.2 | 760 | 790 | $13,259 |
| Columbia University | 3.9 | 750 | 780 | $12,836 |
| Yale University | 4.6 | 760 | 780 | $16,341 |
| Brown University | 5.1 | 760 | 780 | $26,308 |
| Princeton University | 5.7 | 760 | 780 | $11,080 |
| Dartmouth College | 6.4 | 760 | 790 | $33,023 |
| University of Pennsylvania | 6.5 | 750 | 790 | $14,851 |
| Cornell University | 7.5 | 750 | 780 | $29,011 |
*Costs after receiving federal financial aid.
Additionally, Dartmouth has the highest average annual cost at $33,000. Princeton has the lowest at $11,100.
While student debt has surged in the United States in recent years, hitting $1.73 trillion in 2023, the worth of obtaining a degree from any of the schools listed surpasses mere academics. This is evidenced by the substantial incomes earned by former students.
Harvard grads, for example, have the highest average starting salary in the country, at $91,700.

-

 Green2 weeks ago
Ranked: Top Countries by Total Forest Loss Since 2001
-

 Travel1 week ago
Ranked: The World’s Top Flight Routes, by Revenue
-

 Technology2 weeks ago
Ranked: Semiconductor Companies by Industry Revenue Share
-

 Money2 weeks ago
Which States Have the Highest Minimum Wage in America?
-

 Real Estate2 weeks ago
Ranked: The Most Valuable Housing Markets in America
-

 Markets2 weeks ago
Charted: Big Four Market Share by S&P 500 Audits
-

 AI2 weeks ago
The Stock Performance of U.S. Chipmakers So Far in 2024
-

 Automotive2 weeks ago
Almost Every EV Stock is Down After Q1 2024