Mapped: Europe’s GDP Per Capita, by Country
The Growth of a $1,000 Equity Investment, by Stock Market
Mapped: The Most Valuable Company in Each Southeast Asian Country
Visualizing Global Inflation Forecasts (2024-2026)
The World’s Fastest Growing Emerging Markets (2024-2029 Forecast)
Countries With the Highest Rates of Crypto Ownership
Mapped: The Number of AI Startups By Country
All of the Grants Given by the U.S. CHIPS Act
Visualizing AI Patents by Country
How Tech Logos Have Evolved Over Time
Visualizing the Tax Burden of Every U.S. State
Charted: What Frustrates Americans About the Tax System
Ranked: The Top 20 Countries in Debt to China
Charted: Which Country Has the Most Billionaires in 2024?
Charted: Which City Has the Most Billionaires in 2024?
Life Expectancy by Region (1950-2050F)
What Causes Preventable Child Deaths?
The Cost of an EpiPen in Major Markets
Charted: Global Tobacco Use by Country and Sex
Visualized: What Lives in Your Gut Microbiome?
Who’s Building the Most Solar Energy?
Mapped: The Age of Energy Projects in Interconnection Queues, by State
Ranked: The Top 10 EV Battery Manufacturers in 2023
The World’s Biggest Nuclear Energy Producers
The World’s Biggest Oil Producers in 2023
Mapped: U.S. Immigrants by Region
Mapped: Southeast Asia’s GDP Per Capita, by Country
The Largest Earthquakes in the New York Area (1970-2024)
Mapped: Average Wages Across Europe
Mapped: Asia’s Population Patterns by Density
Where the World’s Aluminum is Smelted, by Country
Visualizing Global Gold Production in 2023
Gold vs. S&P 500: Which Has Grown More Over Five Years?
Charted: The Value Gap Between the Gold Price and Gold Miners
How People Get Around in America, Europe, and Asia
The Carbon Footprint of Major Travel Methods
Ranking the Top 15 Countries by Carbon Tax Revenue
Ranked: The Countries With the Most Air Pollution in 2023
Top Countries By Forest Growth Since 2001
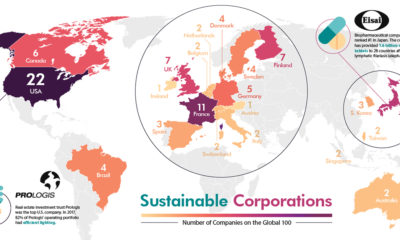
The world's most sustainable corporations have a monumental impact on social and environmental issues. See where they are located in this visualization.
We count down our favorite infographics and charts from the year, including many you may not have seen before. Catch some of our best work in...
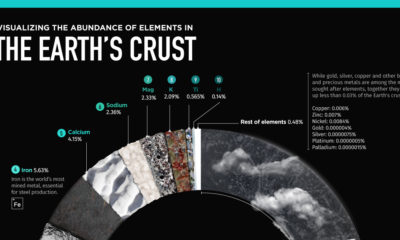
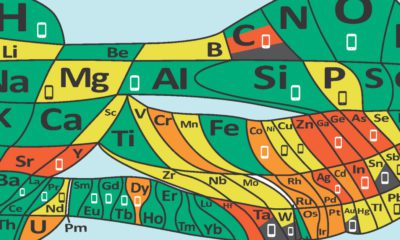
90 different elements form the building blocks for everything on Earth. Some are being used up, and soon could be endangered.
The Earth's crust makes up 1% of the planet's volume, but provides all the material we use. What elements make up this thin layer we stand...
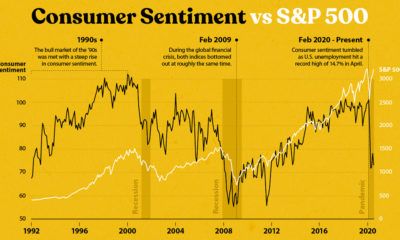
Consumer sentiment has dropped significantly since the emergence of COVID-19, but why haven't stock markets seemed to notice?
What does a road map of the world look like? Here’s a deep view of roads visualized by type across countries and continents.
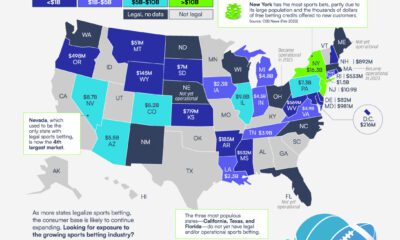
In 2022, the sports betting market showed 75% increase in revenue. This growth is driven by innovative technologies and the legalization of sports betting in most...
In 2022, legal sports betting in the U.S. totaled over $93 billion. Which states saw the most and least wagers? (Sponsored post)
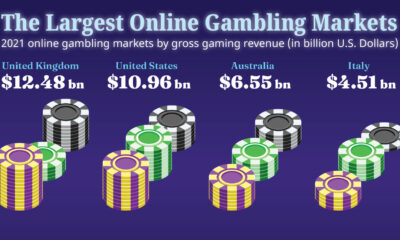
Which countries have the biggest online gambling markets? This graphic highlights the countries earning the highest gross revenues from online gambling.
In this visualization, we rank the top 50 websites that receive the most internet traffic, from Google to CNN.


 Creator Program