Mapped: Europe’s GDP Per Capita, by Country
The Growth of a $1,000 Equity Investment, by Stock Market
Mapped: The Most Valuable Company in Each Southeast Asian Country
Visualizing Global Inflation Forecasts (2024-2026)
The World’s Fastest Growing Emerging Markets (2024-2029 Forecast)
Mapped: The Number of AI Startups By Country
All of the Grants Given by the U.S. CHIPS Act
Visualizing AI Patents by Country
How Tech Logos Have Evolved Over Time
Ranked: Semiconductor Companies by Industry Revenue Share
Ranked: The Top 20 Countries in Debt to China
Charted: Which Country Has the Most Billionaires in 2024?
Charted: Which City Has the Most Billionaires in 2024?
Charted: Who Has Savings in This Economy?
How Debt-to-GDP Ratios Have Changed Since 2000
Life Expectancy by Region (1950-2050F)
What Causes Preventable Child Deaths?
The Cost of an EpiPen in Major Markets
Charted: Global Tobacco Use by Country and Sex
Visualized: What Lives in Your Gut Microbiome?
Who’s Building the Most Solar Energy?
Mapped: The Age of Energy Projects in Interconnection Queues, by State
Ranked: The Top 10 EV Battery Manufacturers in 2023
The World’s Biggest Nuclear Energy Producers
The World’s Biggest Oil Producers in 2023
The Largest Earthquakes in the New York Area (1970-2024)
Mapped: Average Wages Across Europe
Mapped: Asia’s Population Patterns by Density
A Map of Global Happiness By Country in 2024
Mapped: Population Growth by Region (1900-2050F)
Visualizing Global Gold Production in 2023
Gold vs. S&P 500: Which Has Grown More Over Five Years?
Charted: The Value Gap Between the Gold Price and Gold Miners
Charted: Global Uranium Reserves, by Country
The Carbon Footprint of Major Travel Methods
Ranking the Top 15 Countries by Carbon Tax Revenue
Ranked: The Countries With the Most Air Pollution in 2023
Top Countries By Forest Growth Since 2001
Ranked: Top Countries by Total Forest Loss Since 2001
In 2011, there were 1040.6 million troy oz of silver produced. Of this, 84% was used by industry and the remaining was used as an investment. Interestingly,...
How to Test for Fake Gold or Silver Many precious metals investors like the idea of physical bullion because, unlike paper money, it is difficult to...
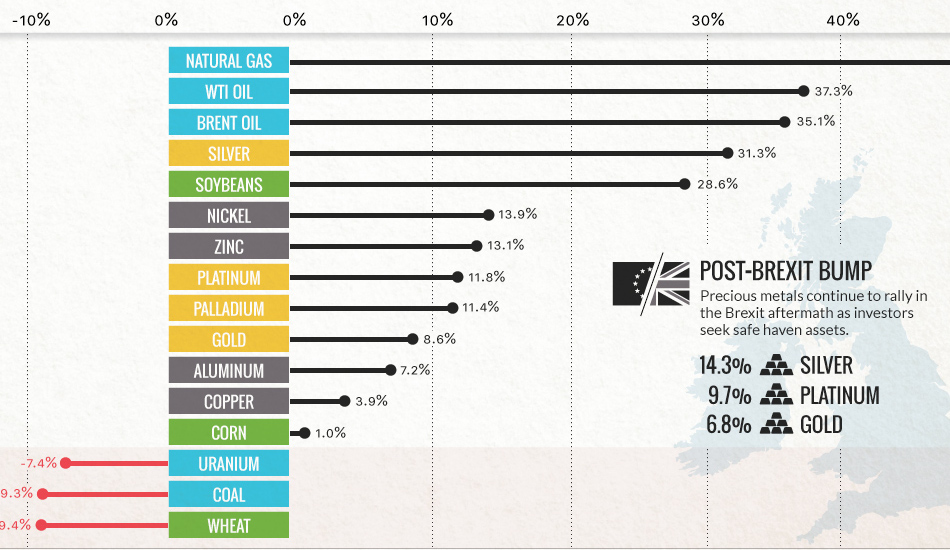
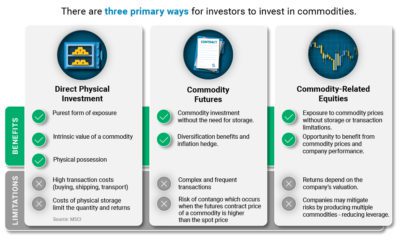
Commodities are back! Precious metals hit two-year highs post-Brexit, while oil and natural gas had their best quarter in years.
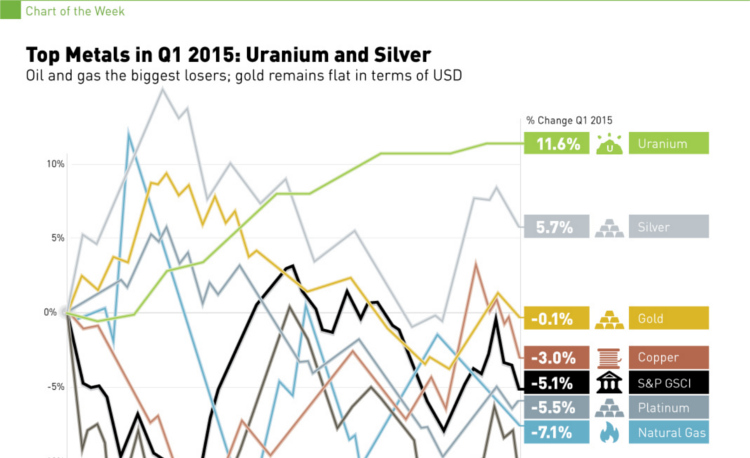
In 2015 Q1, silver and uranium led the way, while oil and natural gas struggled. See all returns in today's Chart of the Week.
The companies that mine or explore for metals offer additional leverage to commodity prices, creating opportunities for astute investors.
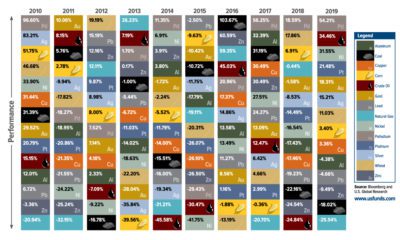
Which commodity had the best returns in 2020? From gold to oil, we show how commodity price performance stacks up over the last decade.
How currency debasement, soaring costs, and overtaxing helped lead to the collapse of Ancient Rome's economy and empire.
In this list, we count down the 14 best Visual Capitalist infographics of 2014.
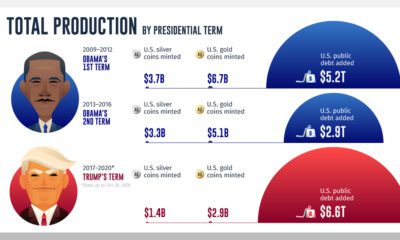
While gold and silver coin production during U.S. presidencies has declined, public debt continues to climb to historically high levels.