Mapped: The 10 U.S. States With the Lowest Real GDP Growth
Ranked: The World’s 50 Largest Private Equity Firms
Top 10 Countries Most in Debt to the IMF
Ranked: The Top 6 Economies by Share of Global GDP (1980-2024)
Mapped: Europe’s GDP Per Capita, by Country
Countries With the Highest Rates of Crypto Ownership
Mapped: The Number of AI Startups By Country
All of the Grants Given by the U.S. CHIPS Act
Visualizing AI Patents by Country
How Tech Logos Have Evolved Over Time
Visualizing America’s Average Retirement Savings, by Age
Visualizing the Tax Burden of Every U.S. State
Charted: What Frustrates Americans About the Tax System
Ranked: The Top 20 Countries in Debt to China
Mapped: Countries Where Recreational Cannabis is Legal
Which Countries Have the Highest Infant Mortality Rates?
Life Expectancy by Region (1950-2050F)
What Causes Preventable Child Deaths?
The Cost of an EpiPen in Major Markets
Who’s Building the Most Solar Energy?
Mapped: The Age of Energy Projects in Interconnection Queues, by State
Ranked: The Top 10 EV Battery Manufacturers in 2023
The World’s Biggest Nuclear Energy Producers
The World’s Biggest Oil Producers in 2023
Mapped: The Top Exports in Asian Countries
Mapped: U.S. States By Number of Cities Over 250,000 Residents
Mapped: U.S. Immigrants by Region
The Biggest Salt Producing Countries in 2023
Visualizing Copper Production by Country in 2023
Where the World’s Aluminum is Smelted, by Country
Visualizing Global Gold Production in 2023
How People Get Around in America, Europe, and Asia
The Carbon Footprint of Major Travel Methods
Ranking the Top 15 Countries by Carbon Tax Revenue
Ranked: The Countries With the Most Air Pollution in 2023
Top Countries By Forest Growth Since 2001
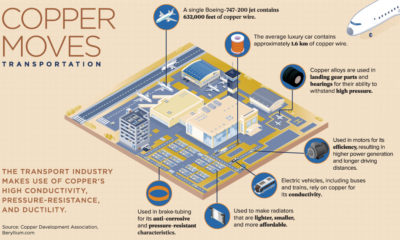
We use copper everywhere in our daily lives. This infographic highlights the uses of copper and its applications in various industries.
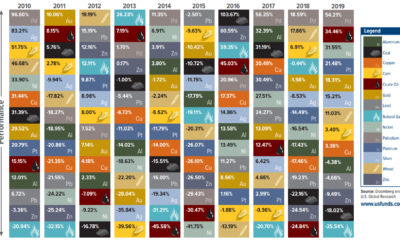
Which individual commodities were the best performers in 2019, and how do those numbers compare to the past decade of data?
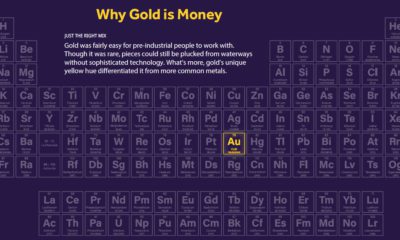
Gold has been used as money for millennia. People often attribute this to beauty, but there are basic physical properties for why gold is money.
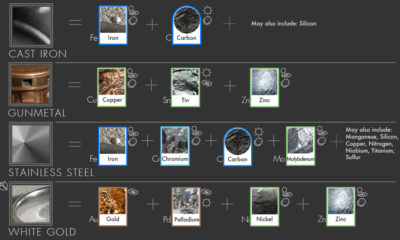
You can't find stainless steel, brass, sterling silver, or white gold on the periodic table. Learn about 20 common metal alloys, and what they are made...
Deep below the ocean's waves, VMS deposits spew out massive amounts of minerals like copper, zinc, and gold, making them a key source of the metals...
Have you ever wondered how much copper is in an electric vehicle? This infographic shows the metal's properties as well as the quantity of copper used.
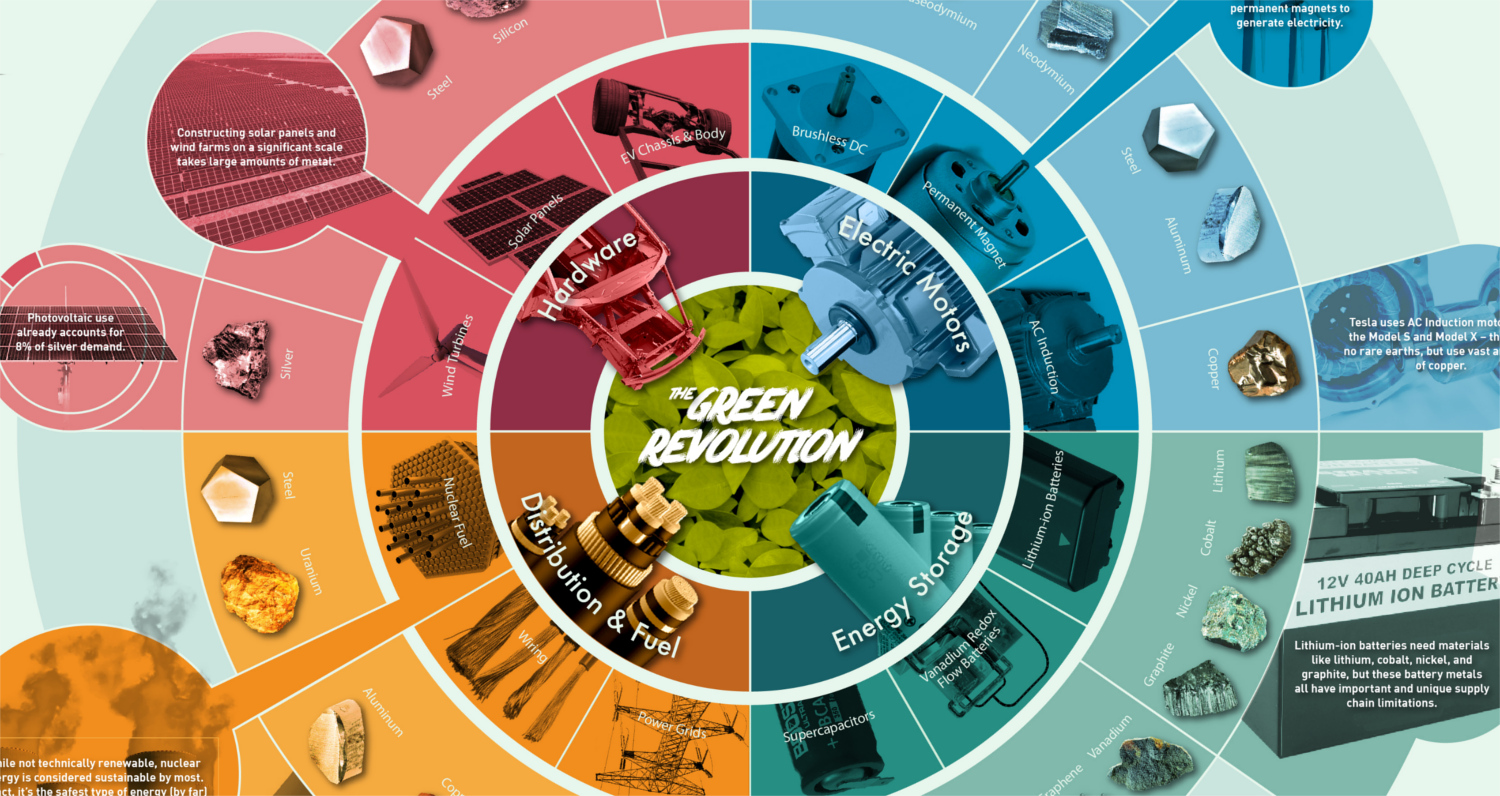
To get off fossil fuels, we'll need other finite resources such as rare metals and minerals. Here are the resources that will power the green revolution.
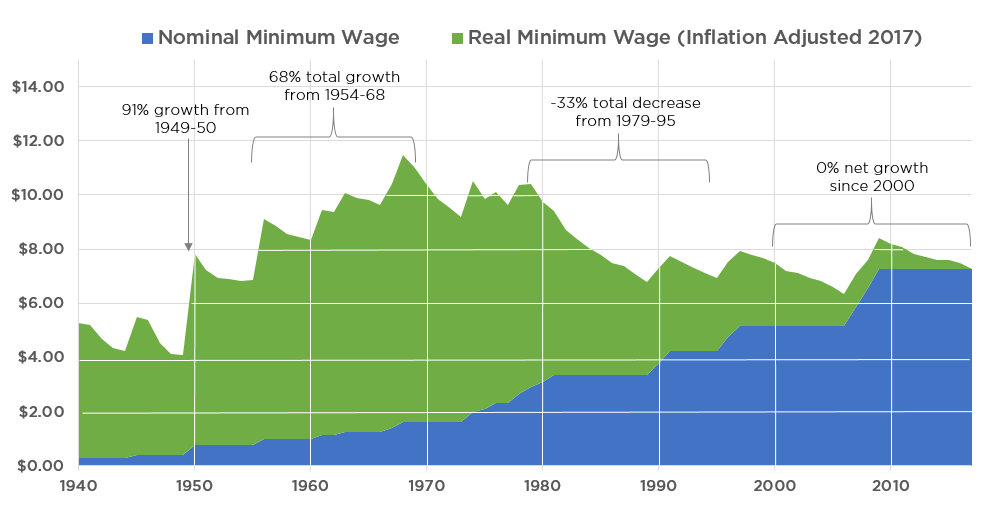
In real terms, the U.S. minimum wage peaked in value in 1968 - and it has actually dropped by more than 30% since then.
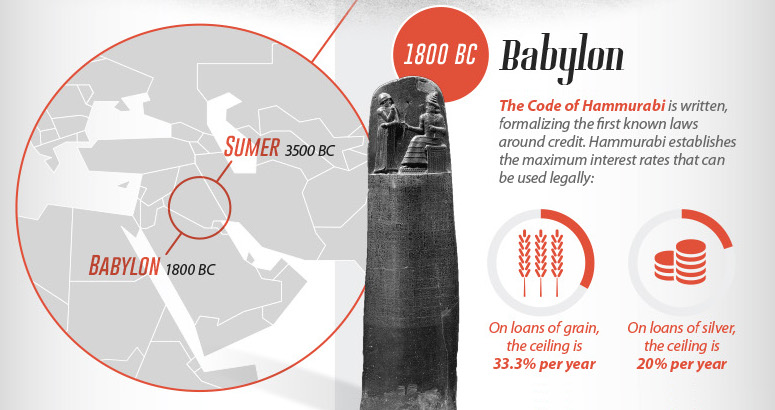
From the writings of antiquity to the innovations that fueled the modern debt boom, we look at the history of consumer credit in this massive infographic.
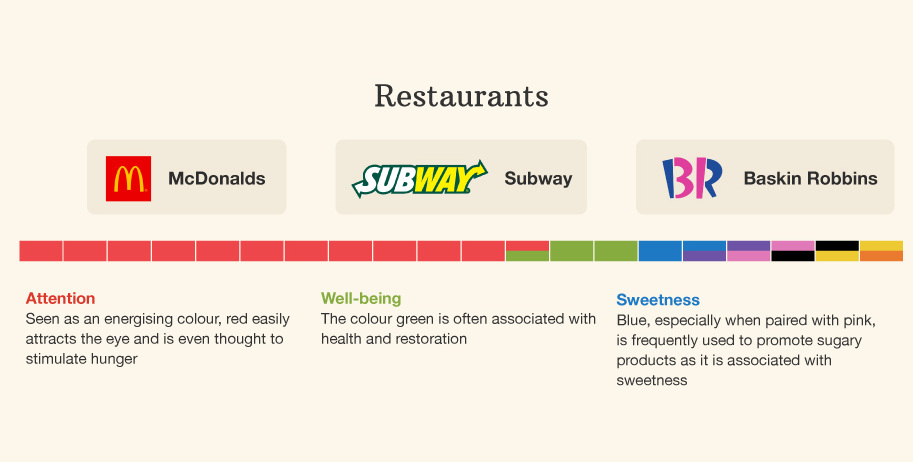
This infographic breaks down the colors used in branding across industries - and it shows how different colors can mean different things based on context.