Mapped: The 10 U.S. States With the Lowest Real GDP Growth
Ranked: The World’s 50 Largest Private Equity Firms
Top 10 Countries Most in Debt to the IMF
Ranked: The Top 6 Economies by Share of Global GDP (1980-2024)
Mapped: Europe’s GDP Per Capita, by Country
Countries With the Highest Rates of Crypto Ownership
Mapped: The Number of AI Startups By Country
All of the Grants Given by the U.S. CHIPS Act
Visualizing AI Patents by Country
How Tech Logos Have Evolved Over Time
Visualizing America’s Average Retirement Savings, by Age
Visualizing the Tax Burden of Every U.S. State
Charted: What Frustrates Americans About the Tax System
Ranked: The Top 20 Countries in Debt to China
Mapped: Countries Where Recreational Cannabis is Legal
Which Countries Have the Highest Infant Mortality Rates?
Life Expectancy by Region (1950-2050F)
What Causes Preventable Child Deaths?
The Cost of an EpiPen in Major Markets
Who’s Building the Most Solar Energy?
Mapped: The Age of Energy Projects in Interconnection Queues, by State
Ranked: The Top 10 EV Battery Manufacturers in 2023
The World’s Biggest Nuclear Energy Producers
The World’s Biggest Oil Producers in 2023
Mapped: The Top Exports in Asian Countries
Mapped: U.S. States By Number of Cities Over 250,000 Residents
Mapped: U.S. Immigrants by Region
The Biggest Salt Producing Countries in 2023
Visualizing Copper Production by Country in 2023
Where the World’s Aluminum is Smelted, by Country
Visualizing Global Gold Production in 2023
How People Get Around in America, Europe, and Asia
The Carbon Footprint of Major Travel Methods
Ranking the Top 15 Countries by Carbon Tax Revenue
Ranked: The Countries With the Most Air Pollution in 2023
Top Countries By Forest Growth Since 2001
Cobalt helps us to power mobile phones, laptops, and electric cars. But while the metal is high in demand for green technology, getting it is the...
We roundup the best infographics, charts, and data visualizations that were posted over the year. Don't miss Visual Capitalist's Top Infographics of 2016!
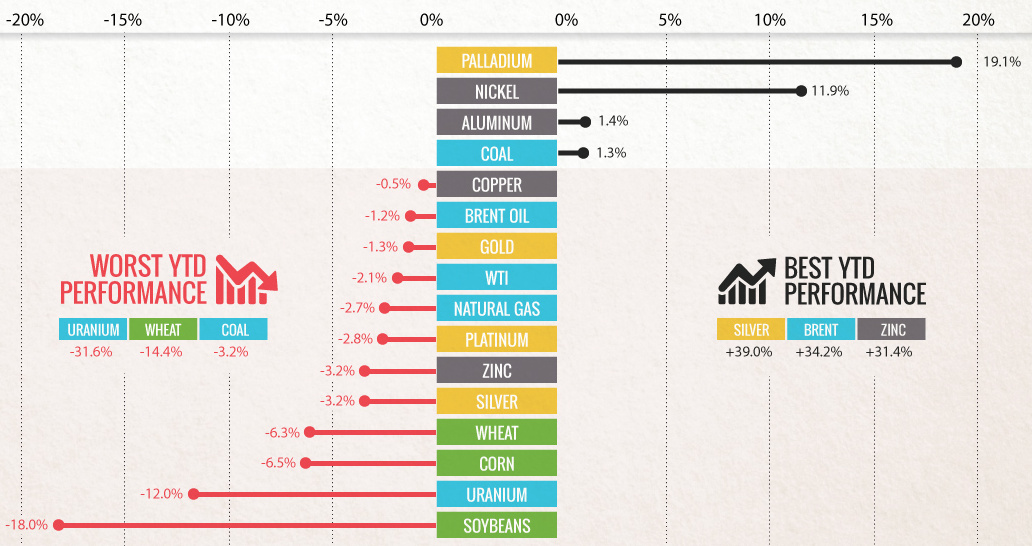
Commodities slumped in Q3 as buyers 'sold in May and went away'. Can commodities shake the summer slump with a U.S. election and OPEC deal in...
How big is $19.5 trillion, really? This infographic visualizes the U.S. national debt in comparison to other numbers that might be more familiar.
This infographic covers everything you should know about copper porphyries, one of the most important sources of gold, copper, and molybdenum.
Klondex Mines is on the path to building a leading integrated gold and silver producer focused in North Central Nevada.
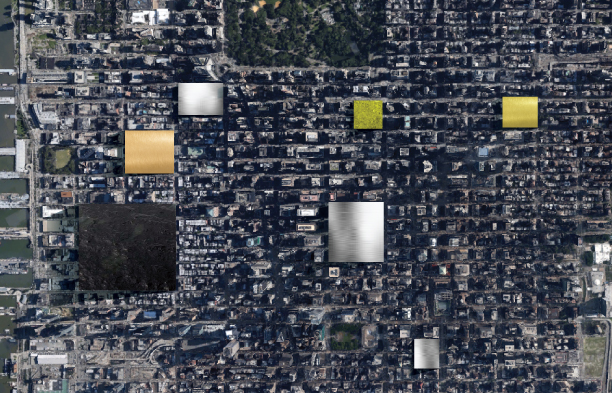
https://beta.quiet.ly/list/share/db1ed-a-year-s-extraction-of-metal-shown-next-to-cities?width=1070&height=800&showGradient=false&showMapView=false&showAuthor=true&showLogo=true&showListTitle=true&showListDescription=true&showTitles=true&showDescriptions=true&showWeblinks=false&makeClickable=false&sharePage=true&showIcons=true&embedTheme=dark&titleSize=18&titleType=quietly&descriptionSize=14&descriptionType=quietly&useOriginalImages=true&lastSlide=default&lastSlideMsg=&lastSlideUrl=http%3A%2F%2Fwww.facebook.com%2Fvisualcapitalist A Year’s Extraction of Metal Shown Next to Landmarks and Cities “One death is a tragedy. One million is a statistic.” – Joseph Stalin For...
Take a look below for everything you would ever need to know about the Stanley Cup: As the NHL playoffs heat up, we bring you the inside...
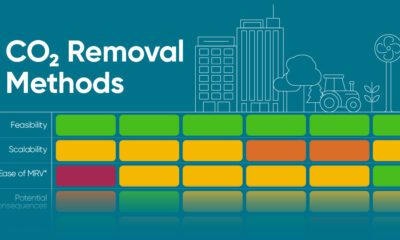
Here's how carbon dioxide removal methods could help us meet net-zero targets and and stabilize the climate.
We visualize the distribution of the world's uranium reserves by country, with 3 countries accounting for more than half of total reserves.