Misc
Color in Branding: What Does it Say About Your Industry?
Color in Branding: What Does it Say About Your Industry?
The use of color can be a powerful way to guide the associations consumers have about a brand, but how and why certain colors are used can often be perplexing.
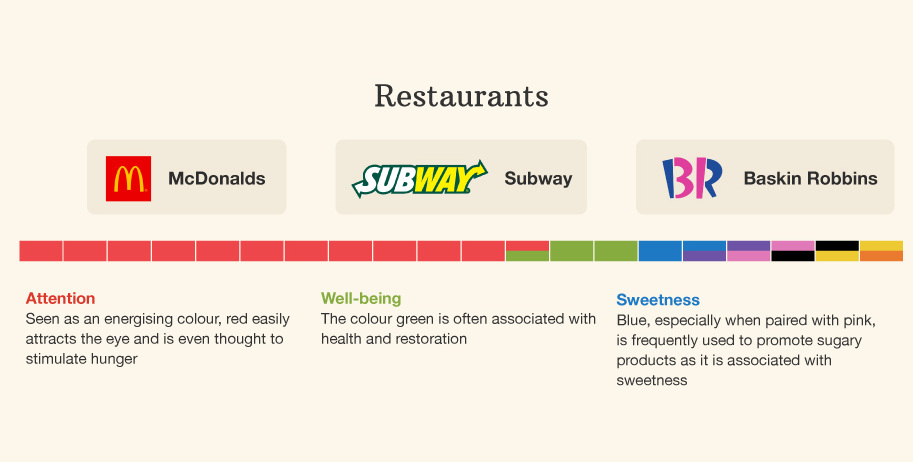
The color red is the perfect example. When it is used as a primary color for McDonald’s, red is meant to energize and attract the attention of potential customers. Red is also thought by some psychologists as a hunger stimulant, which might help them sell more Big Macs and McNuggets at the end of the day.
However, in the case of a company such as British Airways, red is supposed to represent none of those things. For an airline brand, red should be about warmth and a sense of caring, and it ostensibly helps to make customers feel more comfortable flying. For the famous shoe brand Vans, the color red is supposed to evoke feelings of desire and passion, with a hope that customers will link these concepts intrinsically to their brand.
How can red mean so many different things at the same time? The answer is context, much of which is provided by consumers choosing between brands within a particular industry.
Color and Context
When consumers plan to make a purchase decision, they are typically deciding between an evoked set of companies that they’re familiar with for a specific industry or sector. In buying an automobile, for example, a consumer may only to be willing to only consider buying a Toyota, Ford, or Honda.
Since these brands are competing against one another for a “spot” in the mind of consumers, their brands are positioned based on consumer needs and desires in order to win certain associations. Color is an important part of this – but the need is only to differentiate from competitors within an industry, since non-auto brands like McDonald’s or Calvin Klein are not a part of the evoked set of brand choices in this situation.
Therefore, industry context is an essential factor that determines the color choices made by companies for their branding.
Examples: Color in Branding
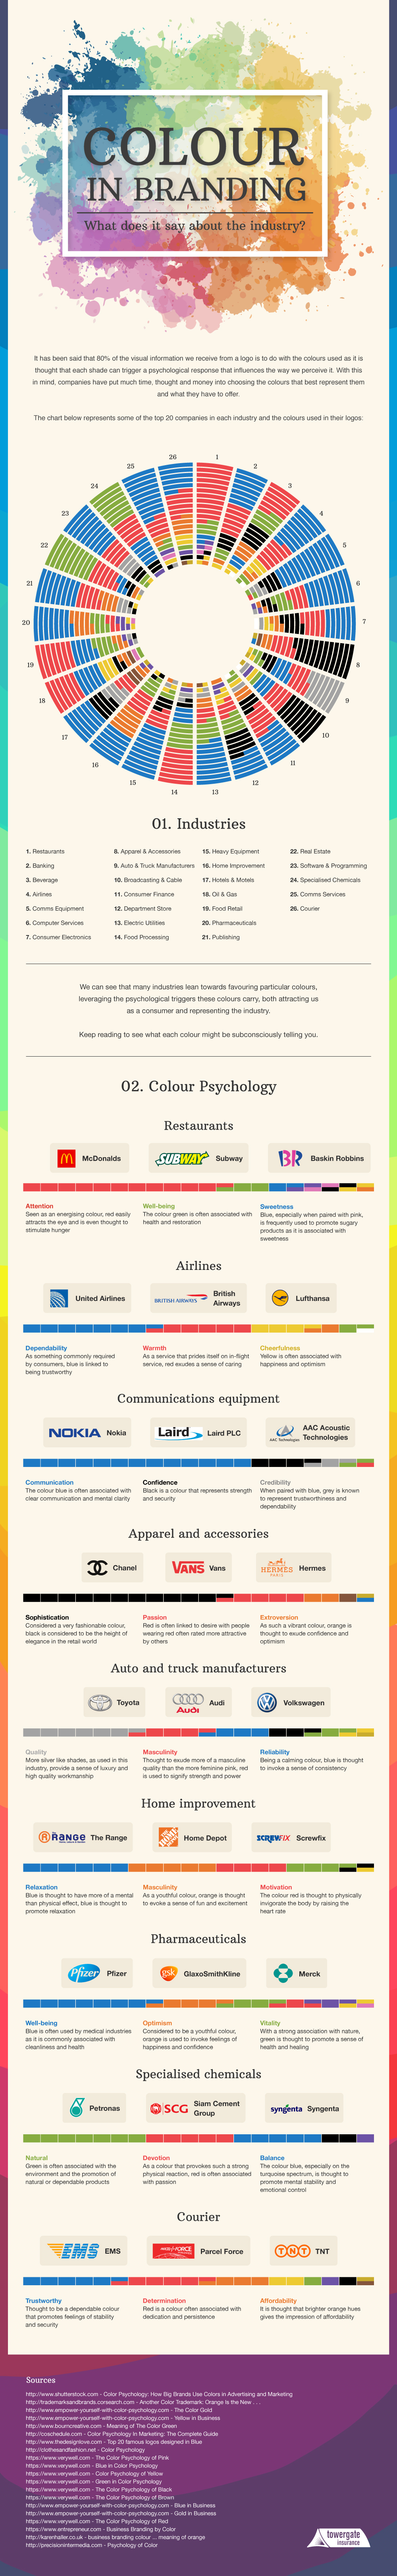
Today’s infographic from Towergate Insurance breaks down 26 industries by the colors used in top brands, providing an additional focus on industries such as autos, pharmaceutical, and apparel to identify the reasons why particular colors are used.
Here are some examples worth thinking about:
Autos
Based on the breakdown of the top 20 brands in the auto industry, it is interesting to see that silver is used with more prominence than in other sectors. Silver provides a sense of luxury and high-quality workmanship. Red and blue are also popular colors for brands in the auto sector. Red can symbol masculinity, while blue is supposed to represent reliability for brands like Volkswagen or Ford.
Pharma
Within the context of pharmaceutical branding, the concepts of health, vitality, and optimism are important. Blue, which is used as a color in branding for companies such as Pfizer, is meant to represent well-being. Meanwhile, GlaxoSmithKline’s orange is meant to be optimistic and energetic. Vitality or health can also be represented with green, which has a strong association with nature and healing.
Apparel
Fashion is dominated by companies that use black as a part of their branding. Of the top 20 apparel and accessory brands, 12 of them use black in their logos to evoke senses of sophistication, formality, style, or luxury.
These include companies such as Chanel, Zara, Adidas, Nike, Oakley, Burberry, Cartier, and many others.


VC+
VC+: Get Our Key Takeaways From the IMF’s World Economic Outlook
A sneak preview of the exclusive VC+ Special Dispatch—your shortcut to understanding IMF’s World Economic Outlook report.

Have you read IMF’s latest World Economic Outlook yet? At a daunting 202 pages, we don’t blame you if it’s still on your to-do list.
But don’t worry, you don’t need to read the whole April release, because we’ve already done the hard work for you.
To save you time and effort, the Visual Capitalist team has compiled a visual analysis of everything you need to know from the report—and our upcoming VC+ Special Dispatch will be available exclusively to VC+ members on Thursday, April 25th.
If you’re not already subscribed to VC+, make sure you sign up now to receive the full analysis of the IMF report, and more (we release similar deep dives every week).
For now, here’s what VC+ members can expect to receive.
Your Shortcut to Understanding IMF’s World Economic Outlook
With long and short-term growth prospects declining for many countries around the world, this Special Dispatch offers a visual analysis of the key figures and takeaways from the IMF’s report including:
- The global decline in economic growth forecasts
- Real GDP growth and inflation forecasts for major nations in 2024
- When interest rate cuts will happen and interest rate forecasts
- How debt-to-GDP ratios have changed since 2000
- And much more!

Get the Full Breakdown in the Next VC+ Special Dispatch
VC+ members will receive the full Special Dispatch on Thursday, April 25th.
Make sure you join VC+ now to receive exclusive charts and the full analysis of key takeaways from IMF’s World Economic Outlook.
Don’t miss out. Become a VC+ member today.
What You Get When You Become a VC+ Member
VC+ is Visual Capitalist’s premium subscription. As a member, you’ll get the following:
- Special Dispatches: Deep dive visual briefings on crucial reports and global trends
- Markets This Month: A snappy summary of the state of the markets and what to look out for
- The Trendline: Weekly curation of the best visualizations from across the globe
- Global Forecast Series: Our flagship annual report that covers everything you need to know related to the economy, markets, geopolitics, and the latest tech trends
- VC+ Archive: Hundreds of previously released VC+ briefings and reports that you’ve been missing out on, all in one dedicated hub
You can get all of the above, and more, by joining VC+ today.

-

 Markets1 week ago
U.S. Debt Interest Payments Reach $1 Trillion
-

 Markets2 weeks ago
Ranked: The Most Valuable Housing Markets in America
-

 Money2 weeks ago
Which States Have the Highest Minimum Wage in America?
-

 AI2 weeks ago
Ranked: Semiconductor Companies by Industry Revenue Share
-

 Markets2 weeks ago
Ranked: The World’s Top Flight Routes, by Revenue
-

 Countries2 weeks ago
Population Projections: The World’s 6 Largest Countries in 2075
-

 Markets2 weeks ago
The Top 10 States by Real GDP Growth in 2023
-

 Money2 weeks ago
The Smallest Gender Wage Gaps in OECD Countries