Technology
Visualizing How Much Countries Spend on R&D
Visualizing How Much Countries Spend on R&D
Innovation can be a major competitive advantage for any developed economy.
However, achieving a sustainable rate of innovation isn’t necessarily a straightforward exercise. The reality is that innovation is a complex and difficult outcome to measure, and there are many different variables that factor into it at a national level.
Research and development (R&D) expenditure is certainly one of these factors – and while it doesn’t always directly correlate with innovation outcomes, it does represent time, capital, and effort being put into researching and designing the products of the future.
Measuring R&D Spend
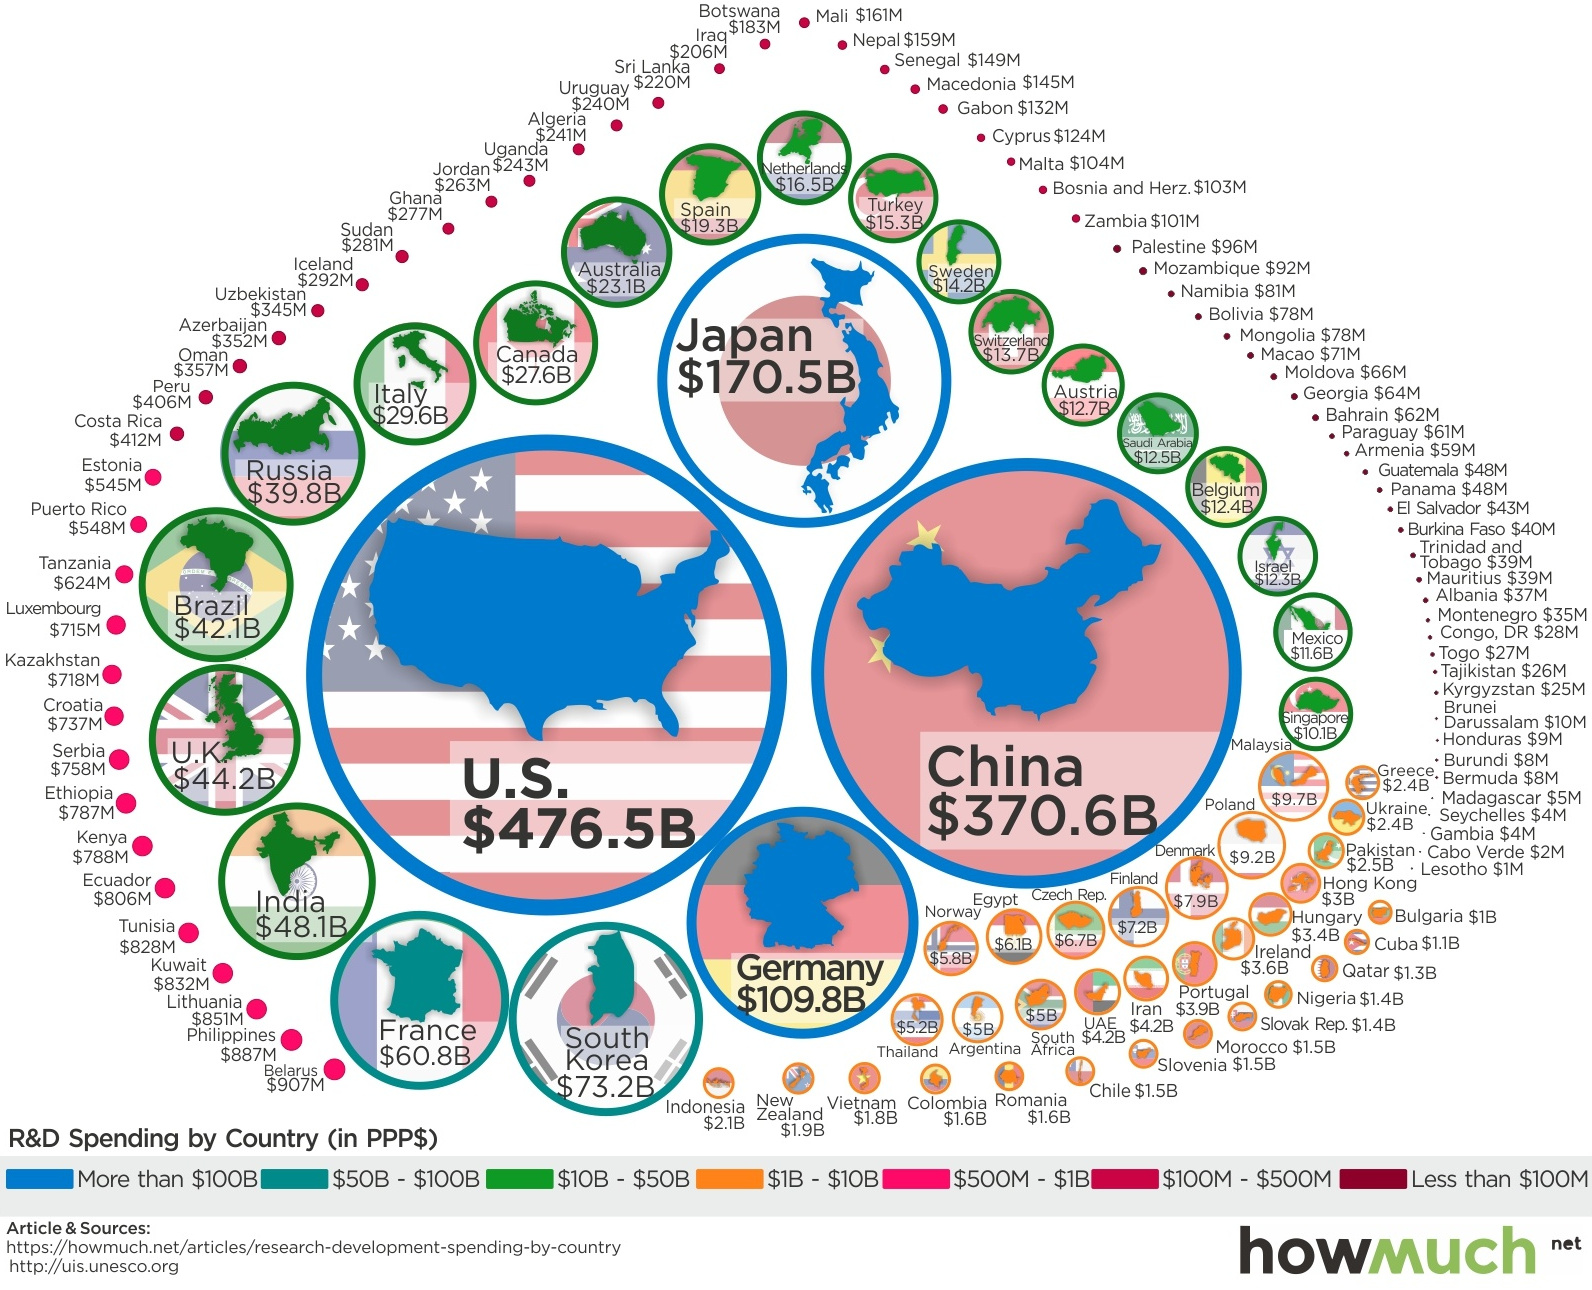
Today’s infographic comes to us from HowMuch.net, and it compares R&D numbers for nearly every country in the world. It uses data from the UNESCO Institute for Statistics adjusted for purchasing-power parity (PPP).
As you can see, R&D expenditures are heavily concentrated at the top of the food chain:
| Rank | Country | R&D Spending (PPP) | Global share (%) |
|---|---|---|---|
| #1 | United States | $476.5 billion | 26.4% |
| #2 | China | $370.6 billion | 20.6% |
| #3 | Japan | $170.5 billion | 9.5% |
| #4 | Germany | $109.8 billion | 6.1% |
| #5 | South Korea | $73.2 billion | 4.1% |
| #6 | France | $60.8 billion | 3.4% |
| #7 | India | $48.1 billion | 2.7% |
| #8 | United Kingdom | $44.2 billion | 2.5% |
| #9 | Brazil | $42.1 billion | 2.3% |
| #10 | Russia | $39.8 billion | 2.2% |
| #11 | Italy | $29.6 billion | 1.6% |
| #12 | Canada | $27.6 billion | 1.5% |
| #13 | Australia | $23.1 billion | 1.3% |
| #14 | Spain | $19.3 billion | 1.1% |
| #15 | Netherlands | $16.5 billion | 0.9% |
| All other countries | $249.8 billion | 13.9% |
Put together the numbers for the U.S. ($476.5 billion) and China ($370.6 billion), and it amounts to 47.0% of total global R&D expenditures. Add in Japan and Germany, and the total goes to 62.5%.
At same time, the countries left off the above list don’t even combine for 15% of the world’s total R&D expenditures.
As a Percentage of GDP
Measuring R&D in absolute terms shows where most of the world’s research happens, but it fails to capture the countries that are spending more in relative terms.
Which countries allocate the highest percentage of their economy to research and development?
| Rank | Country | R&D (as a % of GDP) |
|---|---|---|
| #1 | South Korea | 4.3% |
| #2 | Israel | 4.2% |
| #3 | Japan | 3.4% |
| #4 | Switzerland | 3.2% |
| #5 | Finland | 3.2% |
| #6 | Austria | 3.1% |
| #7 | Sweden | 3.1% |
| #8 | Denmark | 2.9% |
| #9 | Germany | 2.9% |
| #10 | United States | 2.7% |
As you can see, countries like South Korea and Japan allocate the highest portion of their economies to R&D, which is part of the reason they rank so highly on the list in absolute terms as well.
Meanwhile, there are some smaller economies – namely Israel (4.2%) – that spend a far higher portion than normal on research.
Technology
Charting the Next Generation of Internet
In this graphic, Visual Capitalist has partnered with MSCI to explore the potential of satellite internet as the next generation of internet innovation.
Could Tomorrow’s Internet be Streamed from Space?
In 2023, 2.6 billion people could not access the internet. Today, companies worldwide are looking to innovative technology to ensure more people are online at the speed of today’s technology.
Could satellite internet provide the solution?
In collaboration with MSCI, we embarked on a journey to explore whether tomorrow’s internet could be streamed from space.
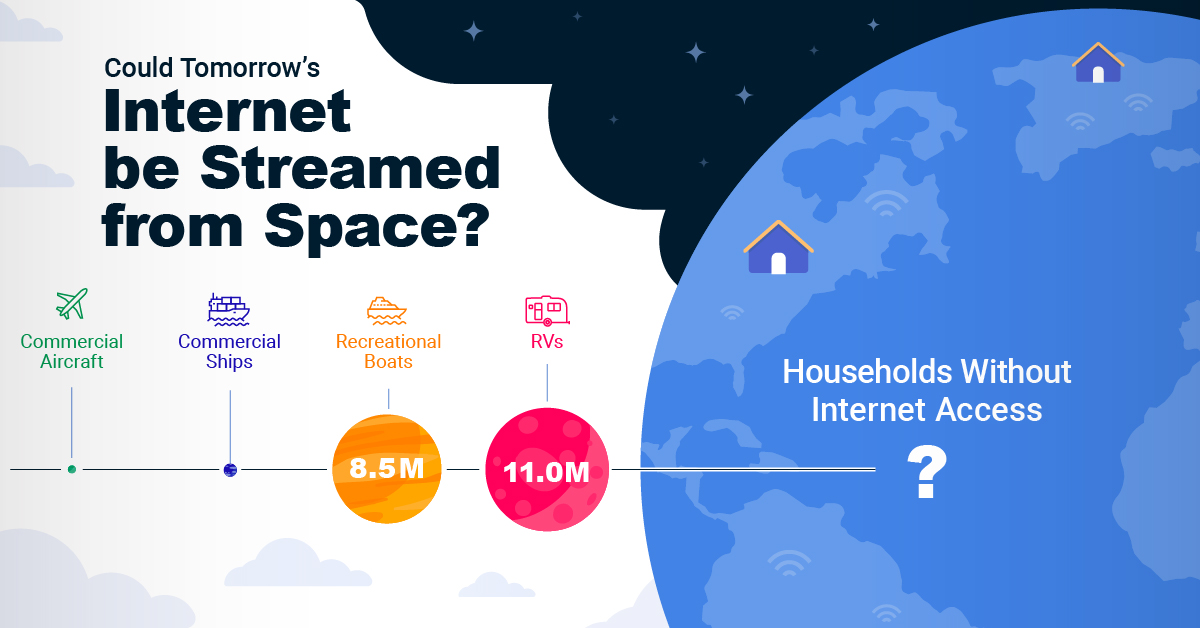
Satellite Internet’s Potential Customer Base
Millions of people live in rural communities or mobile homes, and many spend much of their lives at sea or have no fixed abode. So, they cannot access the internet simply because the technology is unavailable.
Satellite internet gives these communities access to the internet without requiring a fixed location. Consequently, the volume of people who could get online using satellite internet is significant:
| Area | Potential Subscribers |
|---|---|
| Households Without Internet Access | 600,000,000 |
| RVs | 11,000,000 |
| Recreational Boats | 8,500,000 |
| Ships | 100,000 |
| Commercial Aircraft | 25,000 |
Advances in Satellite Technology
Satellite internet is not a new concept. However, it has only recently been that roadblocks around cost and long turnaround times have been overcome.
NASA’s space shuttle, until it was retired in 2011, was the only reusable means of transporting crew and cargo into orbit. It cost over $1.5 billion and took an average of 252 days to launch and refurbish.
In stark contrast, SpaceX’s Falcon 9 can now launch objects into orbit and maintain them at a fraction of the time and cost, less than 1% of the space shuttle’s cost.
| Average Rocket Turnaround Time | Average Launch/Refurbishment Cost | |
|---|---|---|
| Falcon 9* | 21 days | < $1,000,000 |
| Space Shuttle | 252 days | $1,500,000,000 (approximately) |
Satellites are now deployed 300 miles in low Earth orbit (LEO) rather than 22,000 miles above Earth in Geostationary Orbit (GEO), previously the typical satellite deployment altitude.
What this means for the consumer is that satellite internet streamed from LEO has a latency of 40 ms, which is an optimal internet connection. Especially when compared to the 700 ms stream latency experienced with satellite internet streamed from GEO.
What Would it Take to Build a Satellite Internet?
SpaceX, the private company that operates Starlink, currently has 4,500 satellites. However, the company believes it will require 10 times this number to provide comprehensive satellite internet coverage.
Charting the number of active satellites reveals that, despite the increasing number of active satellites, many more must be launched to create a comprehensive satellite internet.
| Year | Number of Active Satellites |
|---|---|
| 2022 | 6,905 |
| 2021 | 4,800 |
| 2020 | 3,256 |
| 2019 | 2,272 |
| 2018 | 2,027 |
| 2017 | 1,778 |
| 2016 | 1,462 |
| 2015 | 1,364 |
| 2014 | 1,262 |
| 2013 | 1,187 |
Next-Generation Internet Innovation
Innovation is at the heart of the internet’s next generation, and the MSCI Next Generation Innovation Index exposes investors to companies that can take advantage of potentially disruptive technologies like satellite internet.
You can gain exposure to companies advancing access to the internet with four indexes:
- MSCI ACWI IMI Next Generation Internet Innovation Index
- MSCI World IMI Next Generation Internet Innovation 30 Index
- MSCI China All Shares IMI Next Generation Internet Innovation Index
- MSCI China A Onshore IMI Next Generation Internet Innovation Index
MSCI thematic indexes are objective, rules-based, and regularly updated to focus on specific emerging trends that could evolve.

Click here to explore the MSCI thematic indexes

-

 Technology7 days ago
Countries With the Highest Rates of Crypto Ownership
While the U.S. is a major market for cryptocurrencies, two countries surpass it in terms of their rates of crypto ownership.
-

 Technology1 week ago
Mapped: The Number of AI Startups By Country
Over the past decade, thousands of AI startups have been funded worldwide. See which countries are leading the charge in this map graphic.
-

 Technology3 weeks ago
All of the Grants Given by the U.S. CHIPS Act
Intel, TSMC, and more have received billions in subsidies from the U.S. CHIPS Act in 2024.
-

 Technology3 weeks ago
Visualizing AI Patents by Country
See which countries have been granted the most AI patents each year, from 2012 to 2022.
-

 Technology3 weeks ago
How Tech Logos Have Evolved Over Time
From complete overhauls to more subtle tweaks, these tech logos have had quite a journey. Featuring: Google, Apple, and more.
-

 AI1 month ago
Ranked: Semiconductor Companies by Industry Revenue Share
Nvidia is coming for Intel’s crown. Samsung is losing ground. AI is transforming the space. We break down revenue for semiconductor companies.
-

 Personal Finance6 days ago
Visualizing the Tax Burden of Every U.S. State
-
 Economy2 weeks ago
The Most Valuable Companies in Major EU Economies
-
 Markets2 weeks ago
The World’s Fastest Growing Emerging Markets (2024-2029 Forecast)
-

 Markets2 weeks ago
Visualizing Global Inflation Forecasts (2024-2026)
-

 Politics2 weeks ago
Charted: What Southeast Asia Thinks About China & the U.S.
-

 Misc1 week ago
The Evolution of U.S. Beer Logos
-

 Healthcare1 week ago
What Causes Preventable Child Deaths?
-
 Energy1 week ago
Who’s Building the Most Solar Energy?

