AI
Which Jobs Will Be Most Impacted by ChatGPT?
Article/Editing:
Jobs Most Impacted by ChatGPT and Similar AI Models
On November 30, 2022, OpenAI heralded a new era of artificial intelligence (AI) by introducing ChatGPT to the world.
The AI chatbot stunned users with its human-like and thorough responses. ChatGPT could comprehend and answer a variety of different questions, make suggestions, research and write essays and briefs, and even tell jokes (amongst other tasks).
Many of these skills are used by workers in their jobs across the world, which begs the question: which jobs will be transformed, or even replaced, by generative AI in the coming future?
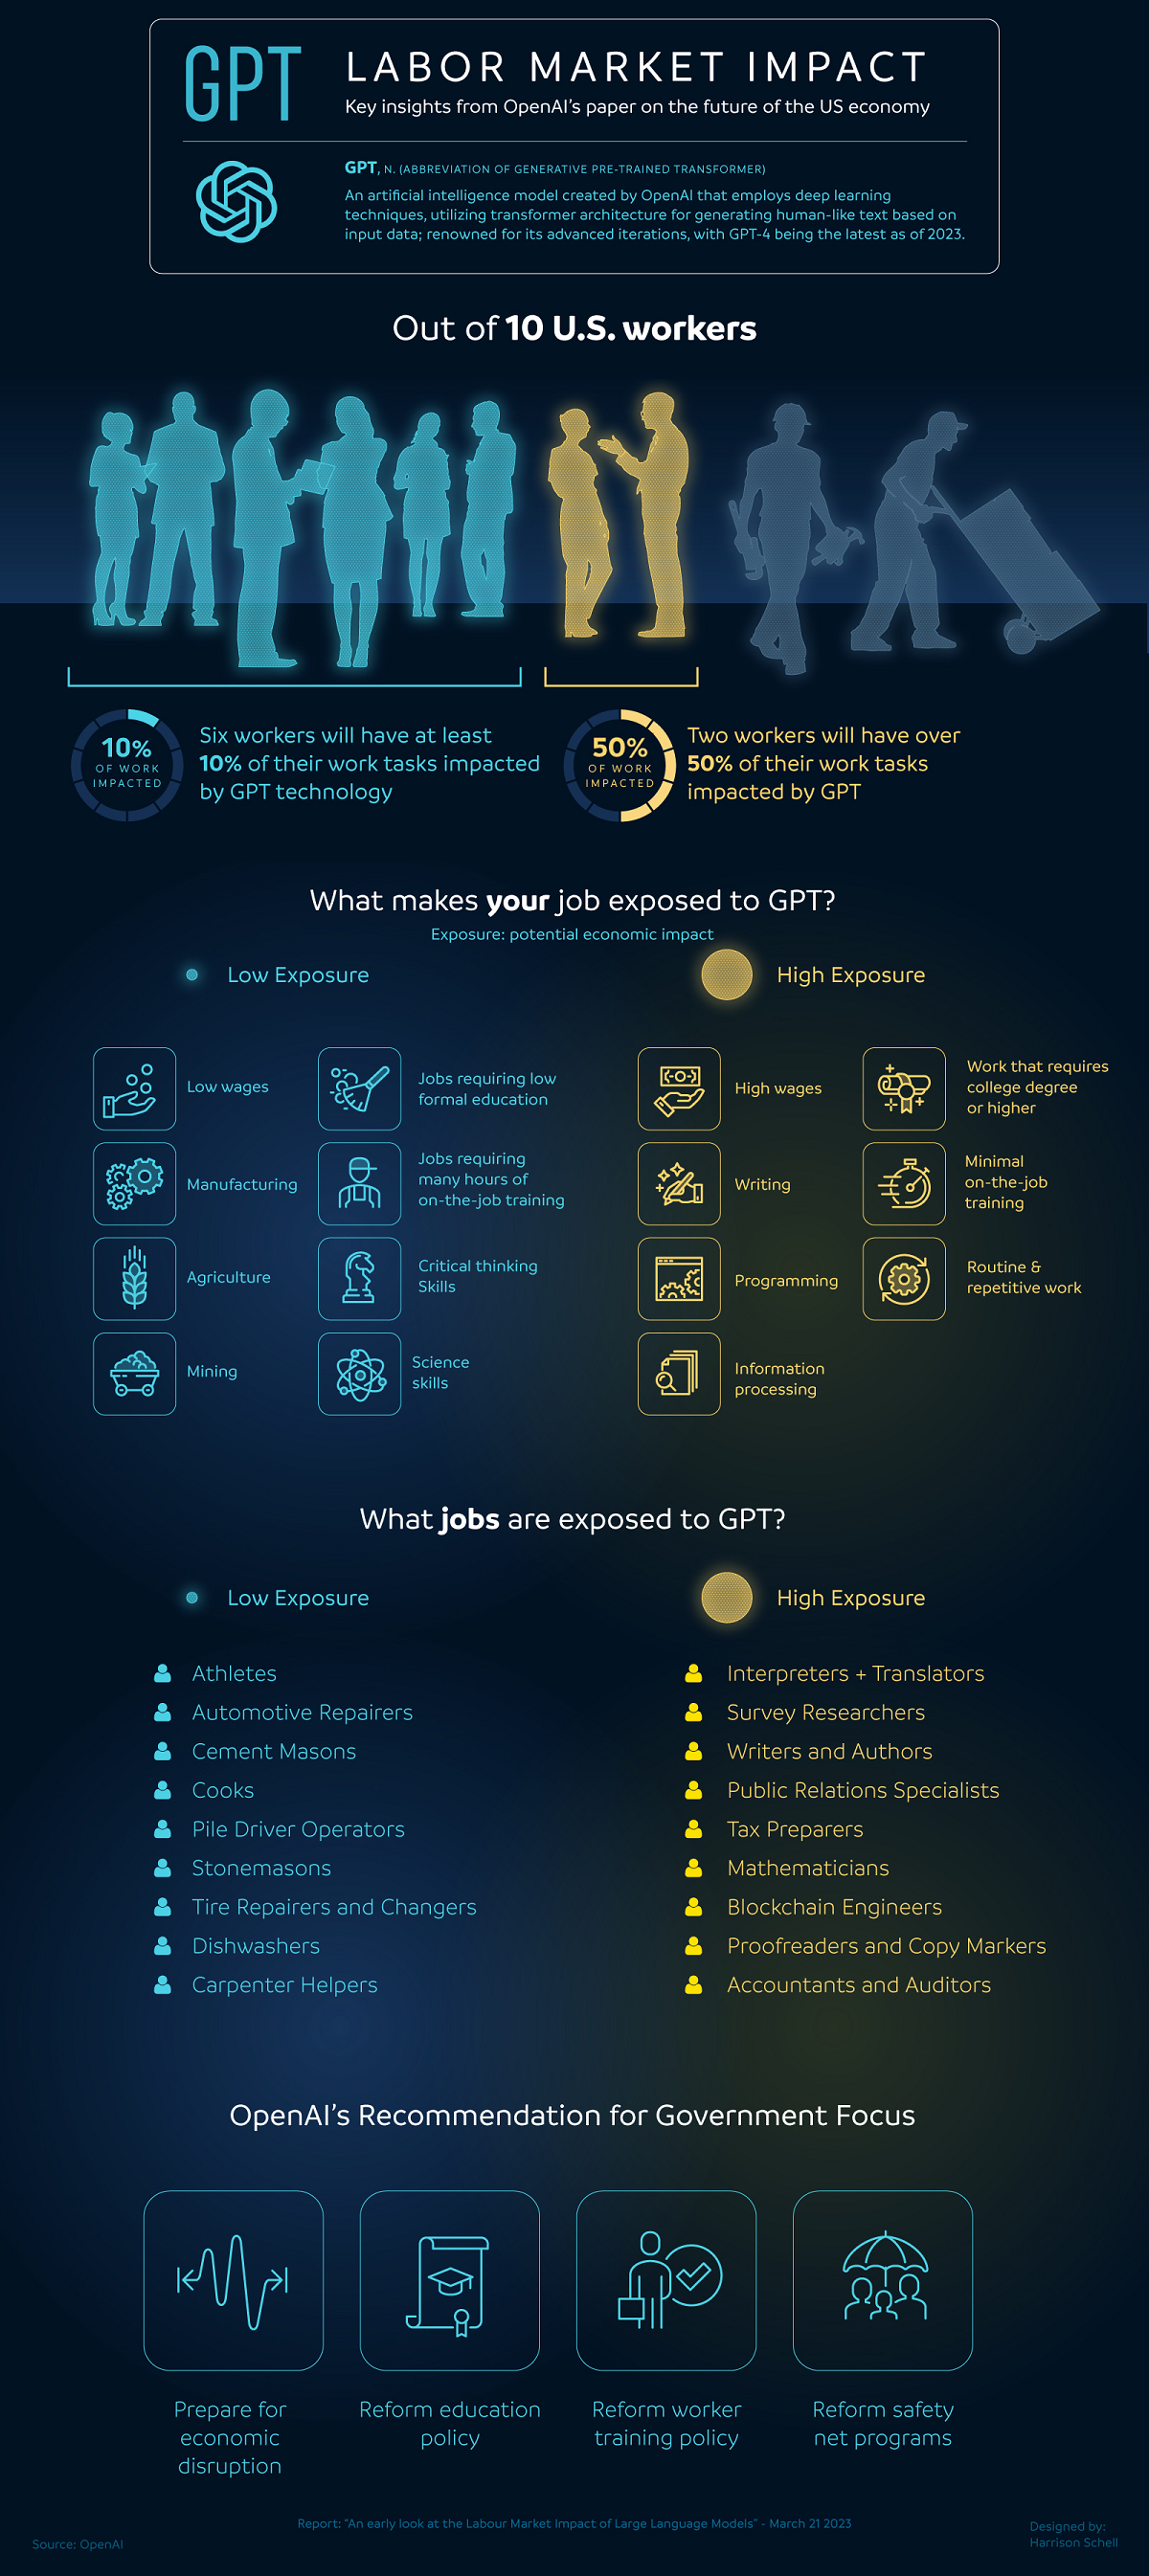
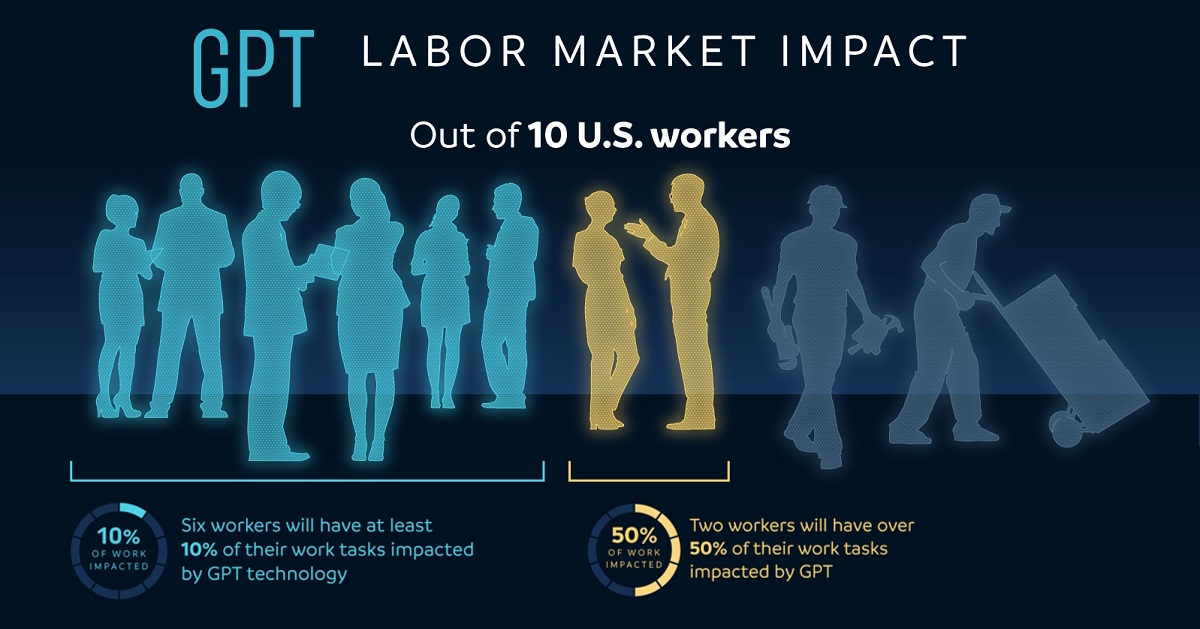
This infographic from Harrison Schell visualizes the March 2023 findings of OpenAI on the potential labor market impact of large language models (LLMs) and various applications of generative AI, including ChatGPT.
Methodology
The OpenAI working paper specifically examined the U.S. industries and jobs most “exposed” to large language models like GPT, which the chatbot ChatGPT operates on.
Key to the paper is the definition of what “exposed” actually means:
“A proxy for potential economic impact without distinguishing between labor-augmenting or labor-displacing effects.” – OpenAI
Thus, the results include both jobs where humans could possibly use AI to optimize their work, along with jobs that could potentially be automated altogether.
OpenAI found that 80% of the American workforce belonged to an occupation where at least 10% of their tasks can be done (or aided) by AI. One-fifth of the workforce belonged to an occupation where 50% of work tasks would be impacted by artificial intelligence.
The Jobs Most and Least at Risk of AI Disruption
Here is a list of jobs highlighted in the paper as likely to see (or already seeing) AI disruption, where AI can reduce the time to do tasks associated with the occupation by at least 50%.
Analysis was provided by a variety of human-made models as well as ChatGPT-4 models, with results from both showing below:
| Jobs | Categorized By | AI Exposure |
|---|---|---|
| Accountants | AI | 100% |
| Admin and legal assistants | AI | 100% |
| Climate change policy analysts | AI | 100% |
| Reporters & journalists | AI | 100% |
| Mathematicians | Human & AI | 100% |
| Tax preparers | Human | 100% |
| Financial analysts | Human | 100% |
| Writers & authors | Human | 100% |
| Web designers | Human | 100% |
| Blockchain engineers | AI | 97.1% |
| Court reporters | AI | 96.4% |
| Proofreaders | AI | 95.5% |
| Correspondence clerks | AI | 95.2% |
| Survey researchers | Human | 84.0% |
| Interpreters/translators | Human | 82.4% |
| PR specialists | Human | 80.6% |
| Animal scientists | Human | 77.8% |
Editor’s note: The paper only highlights some jobs impacted. One AI model found a list of 84 additional jobs that were “fully exposed”, but not all were listed. One human model found 15 additional “fully exposed” jobs that were not listed.
Generally, jobs that require repetitive tasks, some level of data analysis, and routine decision-making were found to face the highest risk of exposure.
Perhaps unsurprisingly, “information processing industries” that involve writing, calculating, and high-level analysis have a higher exposure to LLM-based artificial intelligence. However, science and critical-thinking jobs within those industries negatively correlate with AI exposure.
On the flipside, not every job is likely to be affected. Here’s a list of jobs that are likely least exposed to large language model AI disruption.
| Jobs Least Exposed to AI | |
|---|---|
| Athletes | Short-order cooks |
| Large equipment operators | Barbers/hair stylists |
| Glass installers & repairers | Dredge operators |
| Automotive mechanics | Power-line installers/repairers |
| Masons, carpenters, roofers | Oil field maintenance workers |
| Plumbers, painters, pipefitters | Servers, dishwashers, bartenders |
Naturally, hands-on industries like manufacturing, mining, and agriculture were more protected, but still include information processing roles at risk.
Likewise, the in-person service industry is also expected to see minimal impact from these kinds of AI models. But, patterns are beginning to emerge for job-seekers and industries that may have to contend with artificial intelligence soon.
Artificial Intelligence Impacts on Different Levels of Jobs
OpenAI analyzed correlations between AI exposure in the labor market against a job’s requisite education level, wages, and job-training.
The paper found that jobs with higher wages have a higher exposure to LLM-based AI (though there were numerous low-wage jobs with high exposure as well).
| Job Parameter | AI Exposure Correlation |
|---|---|
| Wages | Direct |
| Education | Direct |
| Training | Inverse |
Professionals with higher education degrees also appeared to be more greatly exposed to AI impact, compared to those without.
However, occupations with a greater level of on-the-job training had the least amount of work tasks exposed, compared to those jobs with little-to-no training.
Will AI’s Impact on the Job Market Be Good or Bad?
The potential impact of ChatGPT and similar AI-driven models on individual job titles depends on several factors, including the nature of the job, the level of automation that is possible, and the exact tasks required.
However, while certain repetitive and predictable tasks can be automated, others that require intangibles like creative input, understanding cultural nuance, reading social cues, or executing good judgement cannot be fully hands-off yet.
And keep in mind that AI exposure isn’t limited to job replacement. Job transformation, with workers utilizing the AI to speed up or improve tasks output, is extremely likely in many of these scenarios. Already, there are employment ads for “AI Whisperers” who can effectively optimize automated responses from generalist AI.
As the AI arms race moves forward at a rapid pace rarely seen before in the history of technology, it likely won’t take long for us to see the full impact of ChatGPT and other LLMs on both jobs and the economy.

This article was published as a part of Visual Capitalist's Creator Program, which features data-driven visuals from some of our favorite Creators around the world.


Technology
Visualizing AI Patents by Country
See which countries have been granted the most AI patents each year, from 2012 to 2022.


Visualizing AI Patents by Country
This was originally posted on our Voronoi app. Download the app for free on iOS or Android and discover incredible data-driven charts from a variety of trusted sources.
This infographic shows the number of AI-related patents granted each year from 2010 to 2022 (latest data available). These figures come from the Center for Security and Emerging Technology (CSET), accessed via Stanford University’s 2024 AI Index Report.
From this data, we can see that China first overtook the U.S. in 2013. Since then, the country has seen enormous growth in the number of AI patents granted each year.
| Year | China | EU and UK | U.S. | RoW | Global Total |
|---|---|---|---|---|---|
| 2010 | 307 | 137 | 984 | 571 | 1,999 |
| 2011 | 516 | 129 | 980 | 581 | 2,206 |
| 2012 | 926 | 112 | 950 | 660 | 2,648 |
| 2013 | 1,035 | 91 | 970 | 627 | 2,723 |
| 2014 | 1,278 | 97 | 1,078 | 667 | 3,120 |
| 2015 | 1,721 | 110 | 1,135 | 539 | 3,505 |
| 2016 | 1,621 | 128 | 1,298 | 714 | 3,761 |
| 2017 | 2,428 | 144 | 1,489 | 1,075 | 5,136 |
| 2018 | 4,741 | 155 | 1,674 | 1,574 | 8,144 |
| 2019 | 9,530 | 322 | 3,211 | 2,720 | 15,783 |
| 2020 | 13,071 | 406 | 5,441 | 4,455 | 23,373 |
| 2021 | 21,907 | 623 | 8,219 | 7,519 | 38,268 |
| 2022 | 35,315 | 1,173 | 12,077 | 13,699 | 62,264 |
In 2022, China was granted more patents than every other country combined.
While this suggests that the country is very active in researching the field of artificial intelligence, it doesn’t necessarily mean that China is the farthest in terms of capability.
Key Facts About AI Patents
According to CSET, AI patents relate to mathematical relationships and algorithms, which are considered abstract ideas under patent law. They can also have different meaning, depending on where they are filed.
In the U.S., AI patenting is concentrated amongst large companies including IBM, Microsoft, and Google. On the other hand, AI patenting in China is more distributed across government organizations, universities, and tech firms (e.g. Tencent).
In terms of focus area, China’s patents are typically related to computer vision, a field of AI that enables computers and systems to interpret visual data and inputs. Meanwhile America’s efforts are more evenly distributed across research fields.
Learn More About AI From Visual Capitalist
If you want to see more data visualizations on artificial intelligence, check out this graphic that shows which job departments will be impacted by AI the most.

-

 Debt1 week ago
How Debt-to-GDP Ratios Have Changed Since 2000
-

 Countries2 weeks ago
Population Projections: The World’s 6 Largest Countries in 2075
-

 Markets2 weeks ago
The Top 10 States by Real GDP Growth in 2023
-

 Demographics2 weeks ago
The Smallest Gender Wage Gaps in OECD Countries
-

 United States2 weeks ago
Where U.S. Inflation Hit the Hardest in March 2024
-

 Green2 weeks ago
Top Countries By Forest Growth Since 2001
-

 United States2 weeks ago
Ranked: The Largest U.S. Corporations by Number of Employees
-

 Maps2 weeks ago
The Largest Earthquakes in the New York Area (1970-2024)