Energy
Visualizing Natural Gas Reserves By Country
Article/Editing:
Visualizing Natural Gas Reserves By Country
Natural gas is used to generate electricity, heat homes and buildings, and power vehicles. It is also a raw material in various industrial processes.
In this graphic, creator Gopalakrishnan Ravichandran ranks natural gas reserves by country. He uses data from the bp Statistical Review, as of September 2023.
Russia Has the Biggest Reserves
Natural gas, coal, and oil have formed over millions of years as plant and animal remains mixed with sediment and undergo pressure and heat.
A natural gas reservoir is a subsurface area where natural gas is trapped within porous and permeable rock formations and confined by impermeable rock or water barriers.
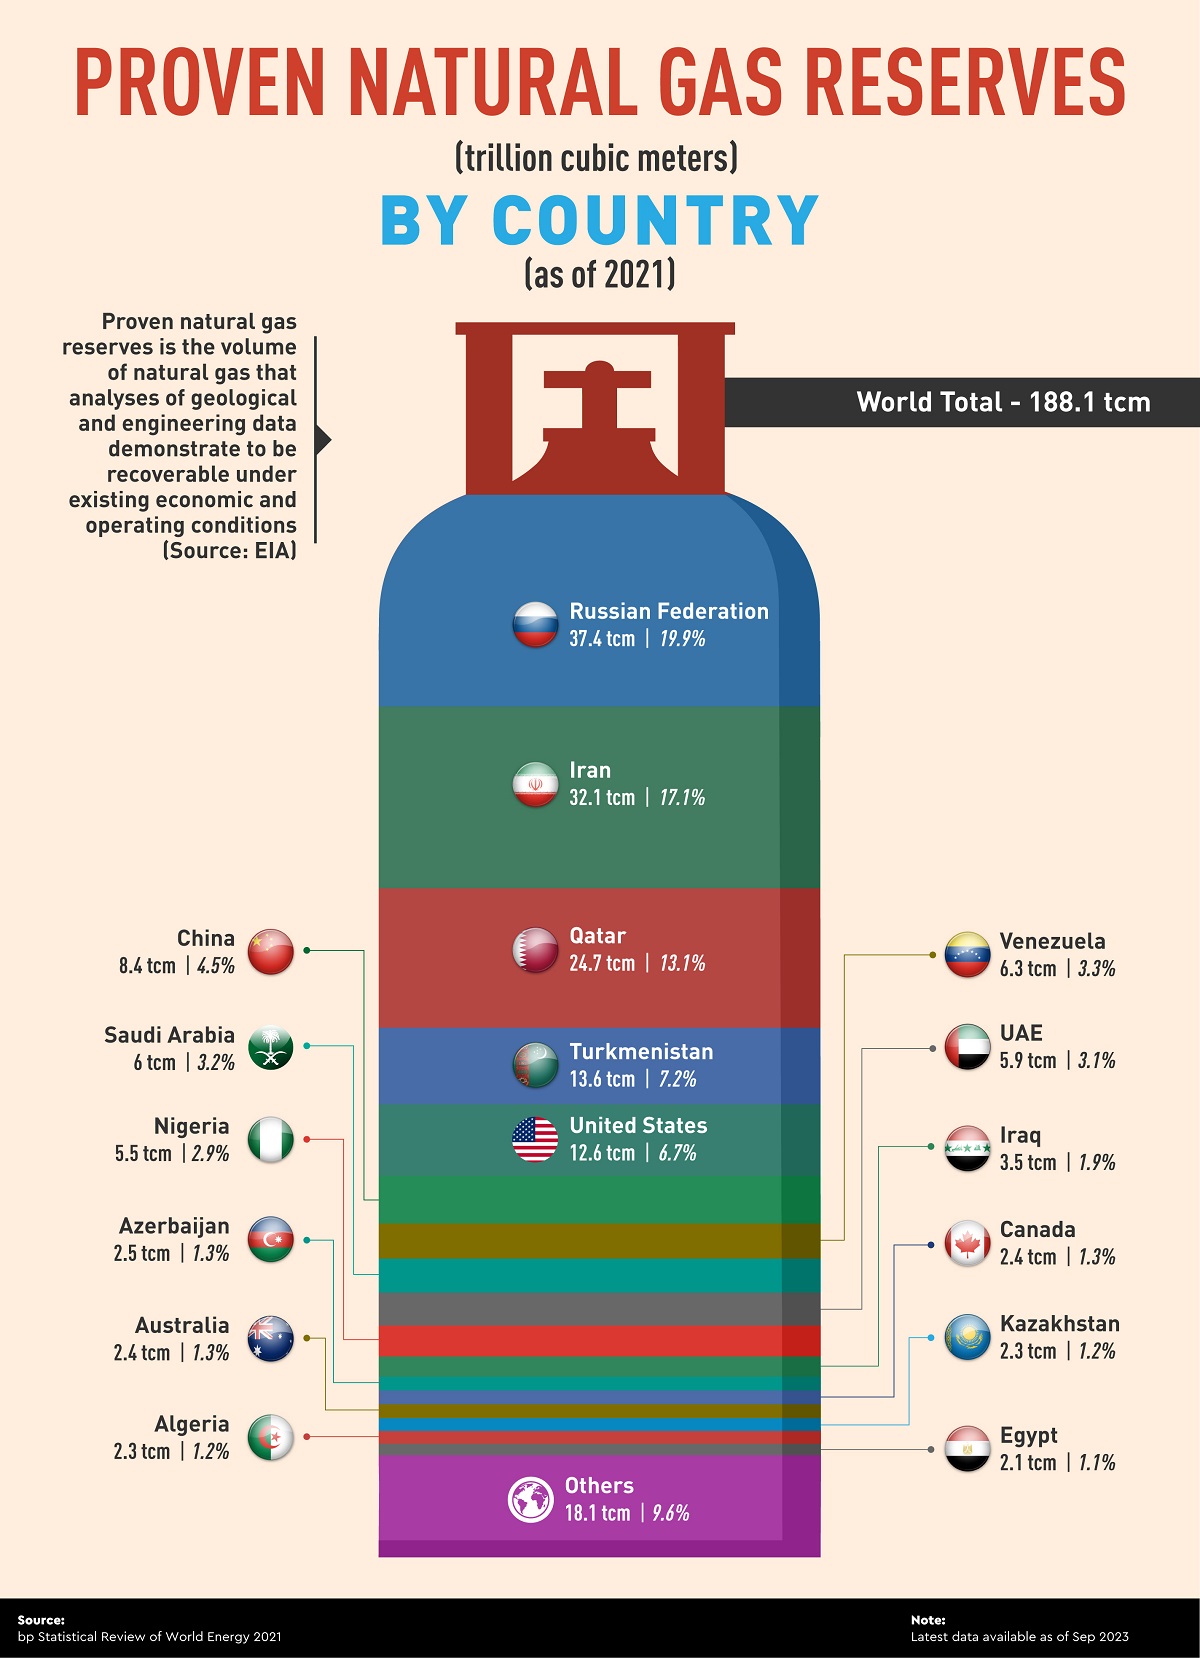
Proven reserves represent the volume of natural gas that can be recovered under existing economic and operating conditions. These reserves can increase when new, successful exploratory wells are drilled.
Russia has the biggest reserves, with 37.4 trillion cubic meters or around 20% of the global total. Iran, in second, has 17% of the total reserves, followed by Qatar with 13%.
| Country | Reserve (tcm) | Percentage |
|---|---|---|
| 🇷🇺 Russian Federation | 37.4 | 19.9% |
| 🇮🇷 Iran | 32.1 | 17.1% |
| 🇶🇦 Qatar | 24.7 | 13.1% |
| 🇹🇲 Turkmenistan | 13.6 | 7.2% |
| 🇺🇸 US | 12.6 | 6.7% |
| 🇨🇳 China | 8.4 | 4.5% |
| 🇻🇪 Venezuela | 6.3 | 3.3% |
| 🇸🇦 Saudi Arabia | 6.0 | 3.2% |
| 🇦🇪 United Arab Emirates | 5.9 | 3.1% |
| 🇳🇬 Nigeria | 5.5 | 2.9% |
| 🇮🇶 Iraq | 3.5 | 1.9% |
| 🇦🇿 Azerbaijan | 2.5 | 1.3% |
| 🇨🇦 Canada | 2.4 | 1.3% |
| 🇦🇺 Australia | 2.4 | 1.3% |
| 🇰🇿 Kazakhstan | 2.3 | 1.2% |
| 🇩🇿 Algeria | 2.3 | 1.2% |
| 🇪🇬 Egypt | 2.1 | 1.1% |
| Others | 18.1 | 9.6% |
| TOTAL | 188.1 | 100.0% |
Asia dominates reserves by region, with six countries among the top 10. Meanwhile, Africa, Europe, North America, and South America each have one representative.
Despite being the 5th in proven reserves, the U.S. is the biggest natural gas producer, with 23% of the global share. Russia comes second (17.4%), with Iran in 3rd place (6.4%).
In addition, the U.S. is also the leading gas exporter, exporting 82.7 billion cubic meters of gas via pipelines in 2022 and 104.3 billion cubic meters of liquefied natural gas (LNG). Russia was the second-largest natural gas exporter globally, followed by Qatar and Norway.

This article was published as a part of Visual Capitalist's Creator Program, which features data-driven visuals from some of our favorite Creators around the world.


Lithium
Ranked: The Top 10 EV Battery Manufacturers in 2023
Asia dominates this ranking of the world’s largest EV battery manufacturers in 2023.


The Top 10 EV Battery Manufacturers in 2023
This was originally posted on our Voronoi app. Download the app for free on iOS or Android and discover incredible data-driven charts from a variety of trusted sources.
Despite efforts from the U.S. and EU to secure local domestic supply, all major EV battery manufacturers remain based in Asia.
In this graphic we rank the top 10 EV battery manufacturers by total battery deployment (measured in megawatt-hours) in 2023. The data is from EV Volumes.
Chinese Dominance
Contemporary Amperex Technology Co. Limited (CATL) has swiftly risen in less than a decade to claim the title of the largest global battery group.
The Chinese company now has a 34% share of the market and supplies batteries to a range of made-in-China vehicles, including the Tesla Model Y, SAIC’s MG4/Mulan, and various Li Auto models.
| Company | Country | 2023 Production (megawatt-hour) | Share of Total Production |
|---|---|---|---|
| CATL | 🇨🇳 China | 242,700 | 34% |
| BYD | 🇨🇳 China | 115,917 | 16% |
| LG Energy Solution | 🇰🇷 Korea | 108,487 | 15% |
| Panasonic | 🇯🇵 Japan | 56,560 | 8% |
| SK On | 🇰🇷 Korea | 40,711 | 6% |
| Samsung SDI | 🇰🇷 Korea | 35,703 | 5% |
| CALB | 🇨🇳 China | 23,493 | 3% |
| Farasis Energy | 🇨🇳 China | 16,527 | 2% |
| Envision AESC | 🇨🇳 China | 8,342 | 1% |
| Sunwoda | 🇨🇳 China | 6,979 | 1% |
| Other | - | 56,040 | 8% |
In 2023, BYD surpassed LG Energy Solution to claim second place. This was driven by demand from its own models and growth in third-party deals, including providing batteries for the made-in-Germany Tesla Model Y, Toyota bZ3, Changan UNI-V, Venucia V-Online, as well as several Haval and FAW models.
The top three battery makers (CATL, BYD, LG) collectively account for two-thirds (66%) of total battery deployment.
Once a leader in the EV battery business, Panasonic now holds the fourth position with an 8% market share, down from 9% last year. With its main client, Tesla, now sourcing batteries from multiple suppliers, the Japanese battery maker seems to be losing its competitive edge in the industry.
Overall, the global EV battery market size is projected to grow from $49 billion in 2022 to $98 billion by 2029, according to Fortune Business Insights.

-

 Education1 week ago
How Hard Is It to Get Into an Ivy League School?
-

 Technology2 weeks ago
Ranked: Semiconductor Companies by Industry Revenue Share
-

 Markets2 weeks ago
Ranked: The World’s Top Flight Routes, by Revenue
-

 Demographics2 weeks ago
Population Projections: The World’s 6 Largest Countries in 2075
-

 Markets2 weeks ago
The Top 10 States by Real GDP Growth in 2023
-

 Demographics2 weeks ago
The Smallest Gender Wage Gaps in OECD Countries
-

 Economy2 weeks ago
Where U.S. Inflation Hit the Hardest in March 2024
-

 Green2 weeks ago
Top Countries By Forest Growth Since 2001