Markets
Which Airlines are Ordering the Most Commercial Jets?
Article/Editing:
![]() See this visualization first on the Voronoi app.
See this visualization first on the Voronoi app.
Which Airlines are Ordering the Most Commercial Jets?
This was originally posted on our Voronoi app. Download the app for free on iOS or Android and discover incredible data-driven charts from a variety of trusted sources.
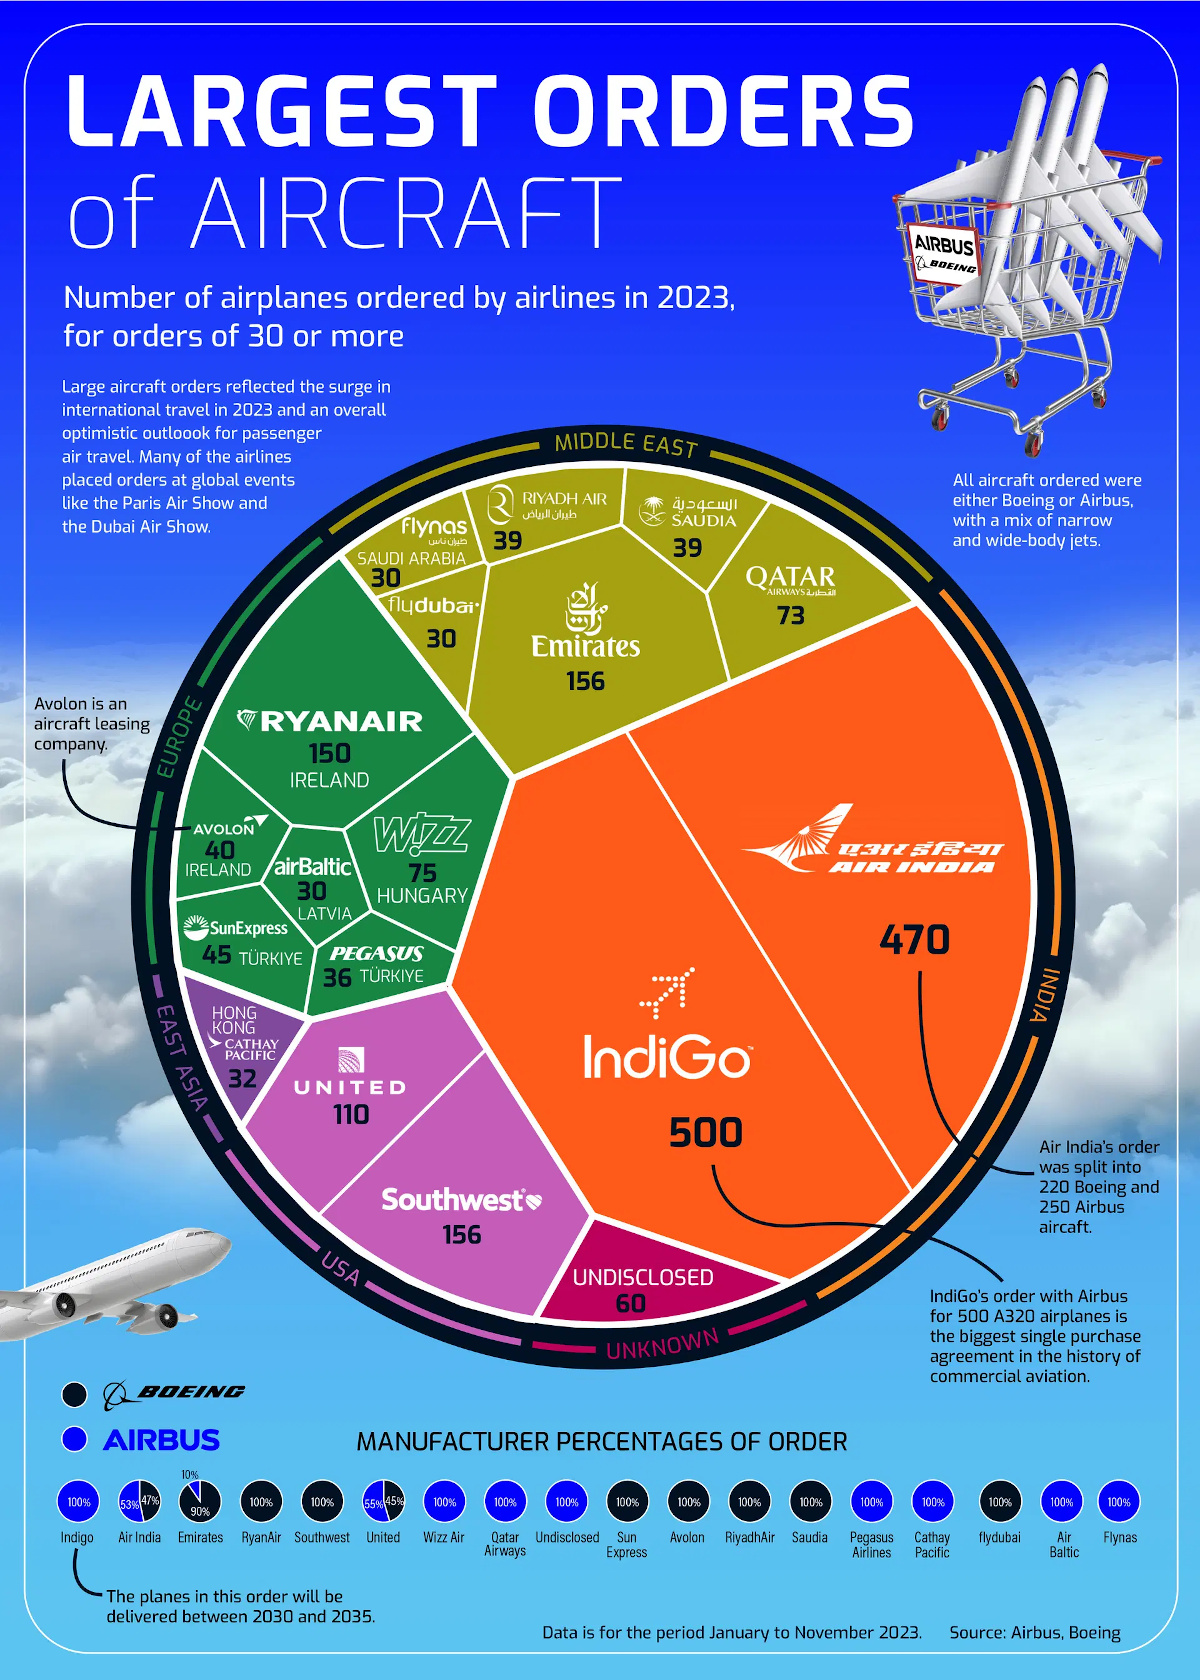
Commercial jet orders hit records in 2023 as travel demand soared.
India’s IndiGo airline ordered 500 jets in June, estimated to be valued at a $55 billion list price. In reality, this price is likely lower given that it was a large order (the financial statements have not yet been disclosed). Just months earlier, Air India ordered 470 jets.
The last time an order was this large was in 2011 with American Airlines purchasing 460 aircraft.
This graphic, from Julie Peasley, shows the biggest orders of aircraft around the world in 2023.
Which Airlines Bought the Most Aircraft?
The aircraft industry is run by a duopoly between Boeing and European giant Airbus, with a commercial jet running at more than $100 million.
Here are the top airlines by aircraft orders in 2023:
| Ranking | Airline | Country | Number of Aircraft Ordered in 2023 |
|---|---|---|---|
| 1 | IndiGo | 🇮🇳 India | 500 |
| 2 | Air India | 🇮🇳 India | 470 |
| 3 | Southwest Airlines | 🇺🇸 U.S. | 156 |
| 4 | Emirates | 🇦🇪 UAE | 156 |
| 5 | Ryanair | 🇮🇪 Ireland | 150 |
| 6 | United Airlines | 🇺🇸 U.S. | 110 |
| 7 | Wizz Air | 🇭🇺 Hungary | 75 |
| 8 | Qatar Airways | 🇶🇦 Qatar | 73 |
| 9 | SunExpress | 🇹🇷 Türkiye | 45 |
| 10 | Avolon | 🇮🇪 Ireland | 40 |
| 11 | Riyadh Air | 🇸🇦 Saudi Arabia | 39 |
| 12 | Saudia | 🇸🇦 Saudi Arabia | 39 |
| 13 | Pegasus | 🇹🇷 Türkiye | 36 |
| 14 | Cathay Pacific | 🇭🇰 Hong Kong SAR | 32 |
| 15 | Flynas | 🇸🇦 Saudi Arabia | 30 |
| 16 | flydubai | 🇦🇪 UAE | 30 |
| 17 | airBaltic | 🇱🇻 Latvia | 30 |
As the above table shows, airlines in India purchased more jets than the next 13 countries combined.
Travel demand in India is projected to boom as the most populous country in the world continues to grow. India is the world’s third-biggest domestic aviation market and by 2042, its market is projected to be five times larger than 2019 levels.
Across India, discretionary spending accounted for 24% of household consumption in 2020, up from 13% in 2000.
Southwest Airlines and United Airlines each purchased over 100 jets. U.S. air travel hit records last year at 16.3 million flights.
Saudi Arabia’s new airline, Riyadh Air, purchased 39 jets as the country looks to boost international tourism. Prior to 2019, most foreign visitors couldn’t travel to the country. The airline is financed by the Public Investment Fund, the Saudi sovereign wealth fund and one of the biggest in the world. This investment is projected to add $20 billion to the economy.
Safety Concerns in the Spotlight
After a window blew out of a Boeing 737 Max 9 aircraft in early January, regulators are requiring the temporary grounding of almost 200 planes for safety inspections.
The Max 9’s are used by just two American airline operators, Alaska Air and United Airlines.
Prior to this incident, deliveries of Max 9’s were delayed due to potential manufacturing flaws involving loose bolts in the rudder-control system. In 2018 and 2019 an earlier version of these planes, the Max 8, crashed twice resulting in the death of 346 passengers. Max 8 and 9 planes were grounded for two years.
The two fatal crashes have cost Boeing an estimated $20 billion in settlements and fines, including a $2.5 billion criminal investigation settlement surrounding safety issues.

This article was published as a part of Visual Capitalist's Creator Program, which features data-driven visuals from some of our favorite Creators around the world.


Economy
Economic Growth Forecasts for G7 and BRICS Countries in 2024
The IMF has released its economic growth forecasts for 2024. How do the G7 and BRICS countries compare?


G7 & BRICS Real GDP Growth Forecasts for 2024
The International Monetary Fund’s (IMF) has released its real gross domestic product (GDP) growth forecasts for 2024, and while global growth is projected to stay steady at 3.2%, various major nations are seeing declining forecasts.
This chart visualizes the 2024 real GDP growth forecasts using data from the IMF’s 2024 World Economic Outlook for G7 and BRICS member nations along with Saudi Arabia, which is still considering an invitation to join the bloc.
Get the Key Insights of the IMF’s World Economic Outlook
Want a visual breakdown of the insights from the IMF’s 2024 World Economic Outlook report?
This visual is part of a special dispatch of the key takeaways exclusively for VC+ members.
Get the full dispatch of charts by signing up to VC+.
Mixed Economic Growth Prospects for Major Nations in 2024
Economic growth projections by the IMF for major nations are mixed, with the majority of G7 and BRICS countries forecasted to have slower growth in 2024 compared to 2023.
Only three BRICS-invited or member countries, Saudi Arabia, the UAE, and South Africa, have higher projected real GDP growth rates in 2024 than last year.
| Group | Country | Real GDP Growth (2023) | Real GDP Growth (2024P) |
|---|---|---|---|
| G7 | 🇺🇸 U.S. | 2.5% | 2.7% |
| G7 | 🇨🇦 Canada | 1.1% | 1.2% |
| G7 | 🇯🇵 Japan | 1.9% | 0.9% |
| G7 | 🇫🇷 France | 0.9% | 0.7% |
| G7 | 🇮🇹 Italy | 0.9% | 0.7% |
| G7 | 🇬🇧 UK | 0.1% | 0.5% |
| G7 | 🇩🇪 Germany | -0.3% | 0.2% |
| BRICS | 🇮🇳 India | 7.8% | 6.8% |
| BRICS | 🇨🇳 China | 5.2% | 4.6% |
| BRICS | 🇦🇪 UAE | 3.4% | 3.5% |
| BRICS | 🇮🇷 Iran | 4.7% | 3.3% |
| BRICS | 🇷🇺 Russia | 3.6% | 3.2% |
| BRICS | 🇪🇬 Egypt | 3.8% | 3.0% |
| BRICS-invited | 🇸🇦 Saudi Arabia | -0.8% | 2.6% |
| BRICS | 🇧🇷 Brazil | 2.9% | 2.2% |
| BRICS | 🇿🇦 South Africa | 0.6% | 0.9% |
| BRICS | 🇪🇹 Ethiopia | 7.2% | 6.2% |
| 🌍 World | 3.2% | 3.2% |
China and India are forecasted to maintain relatively high growth rates in 2024 at 4.6% and 6.8% respectively, but compared to the previous year, China is growing 0.6 percentage points slower while India is an entire percentage point slower.
On the other hand, four G7 nations are set to grow faster than last year, which includes Germany making its comeback from its negative real GDP growth of -0.3% in 2023.
Faster Growth for BRICS than G7 Nations
Despite mostly lower growth forecasts in 2024 compared to 2023, BRICS nations still have a significantly higher average growth forecast at 3.6% compared to the G7 average of 1%.
While the G7 countries’ combined GDP is around $15 trillion greater than the BRICS nations, with continued higher growth rates and the potential to add more members, BRICS looks likely to overtake the G7 in economic size within two decades.
BRICS Expansion Stutters Before October 2024 Summit
BRICS’ recent expansion has stuttered slightly, as Argentina’s newly-elected president Javier Milei declined its invitation and Saudi Arabia clarified that the country is still considering its invitation and has not joined BRICS yet.
Even with these initial growing pains, South Africa’s Foreign Minister Naledi Pandor told reporters in February that 34 different countries have submitted applications to join the growing BRICS bloc.
Any changes to the group are likely to be announced leading up to or at the 2024 BRICS summit which takes place October 22-24 in Kazan, Russia.
Get the Full Analysis of the IMF’s Outlook on VC+
This visual is part of an exclusive special dispatch for VC+ members which breaks down the key takeaways from the IMF’s 2024 World Economic Outlook.
For the full set of charts and analysis, sign up for VC+.

-

 Debt1 week ago
How Debt-to-GDP Ratios Have Changed Since 2000
-

 Markets2 weeks ago
Ranked: The World’s Top Flight Routes, by Revenue
-

 Countries2 weeks ago
Population Projections: The World’s 6 Largest Countries in 2075
-

 Markets2 weeks ago
The Top 10 States by Real GDP Growth in 2023
-

 Demographics2 weeks ago
The Smallest Gender Wage Gaps in OECD Countries
-

 Economy2 weeks ago
Where U.S. Inflation Hit the Hardest in March 2024
-

 Green2 weeks ago
Top Countries By Forest Growth Since 2001
-

 United States2 weeks ago
Ranked: The Largest U.S. Corporations by Number of Employees