United States
China’s Growing Trade Dominance in Latin America
Article/Editing:
China’s Growing Trade Dominance in Latin America
Over the past 20 years, China’s economic presence around the world has grown significantly, including in Latin America.
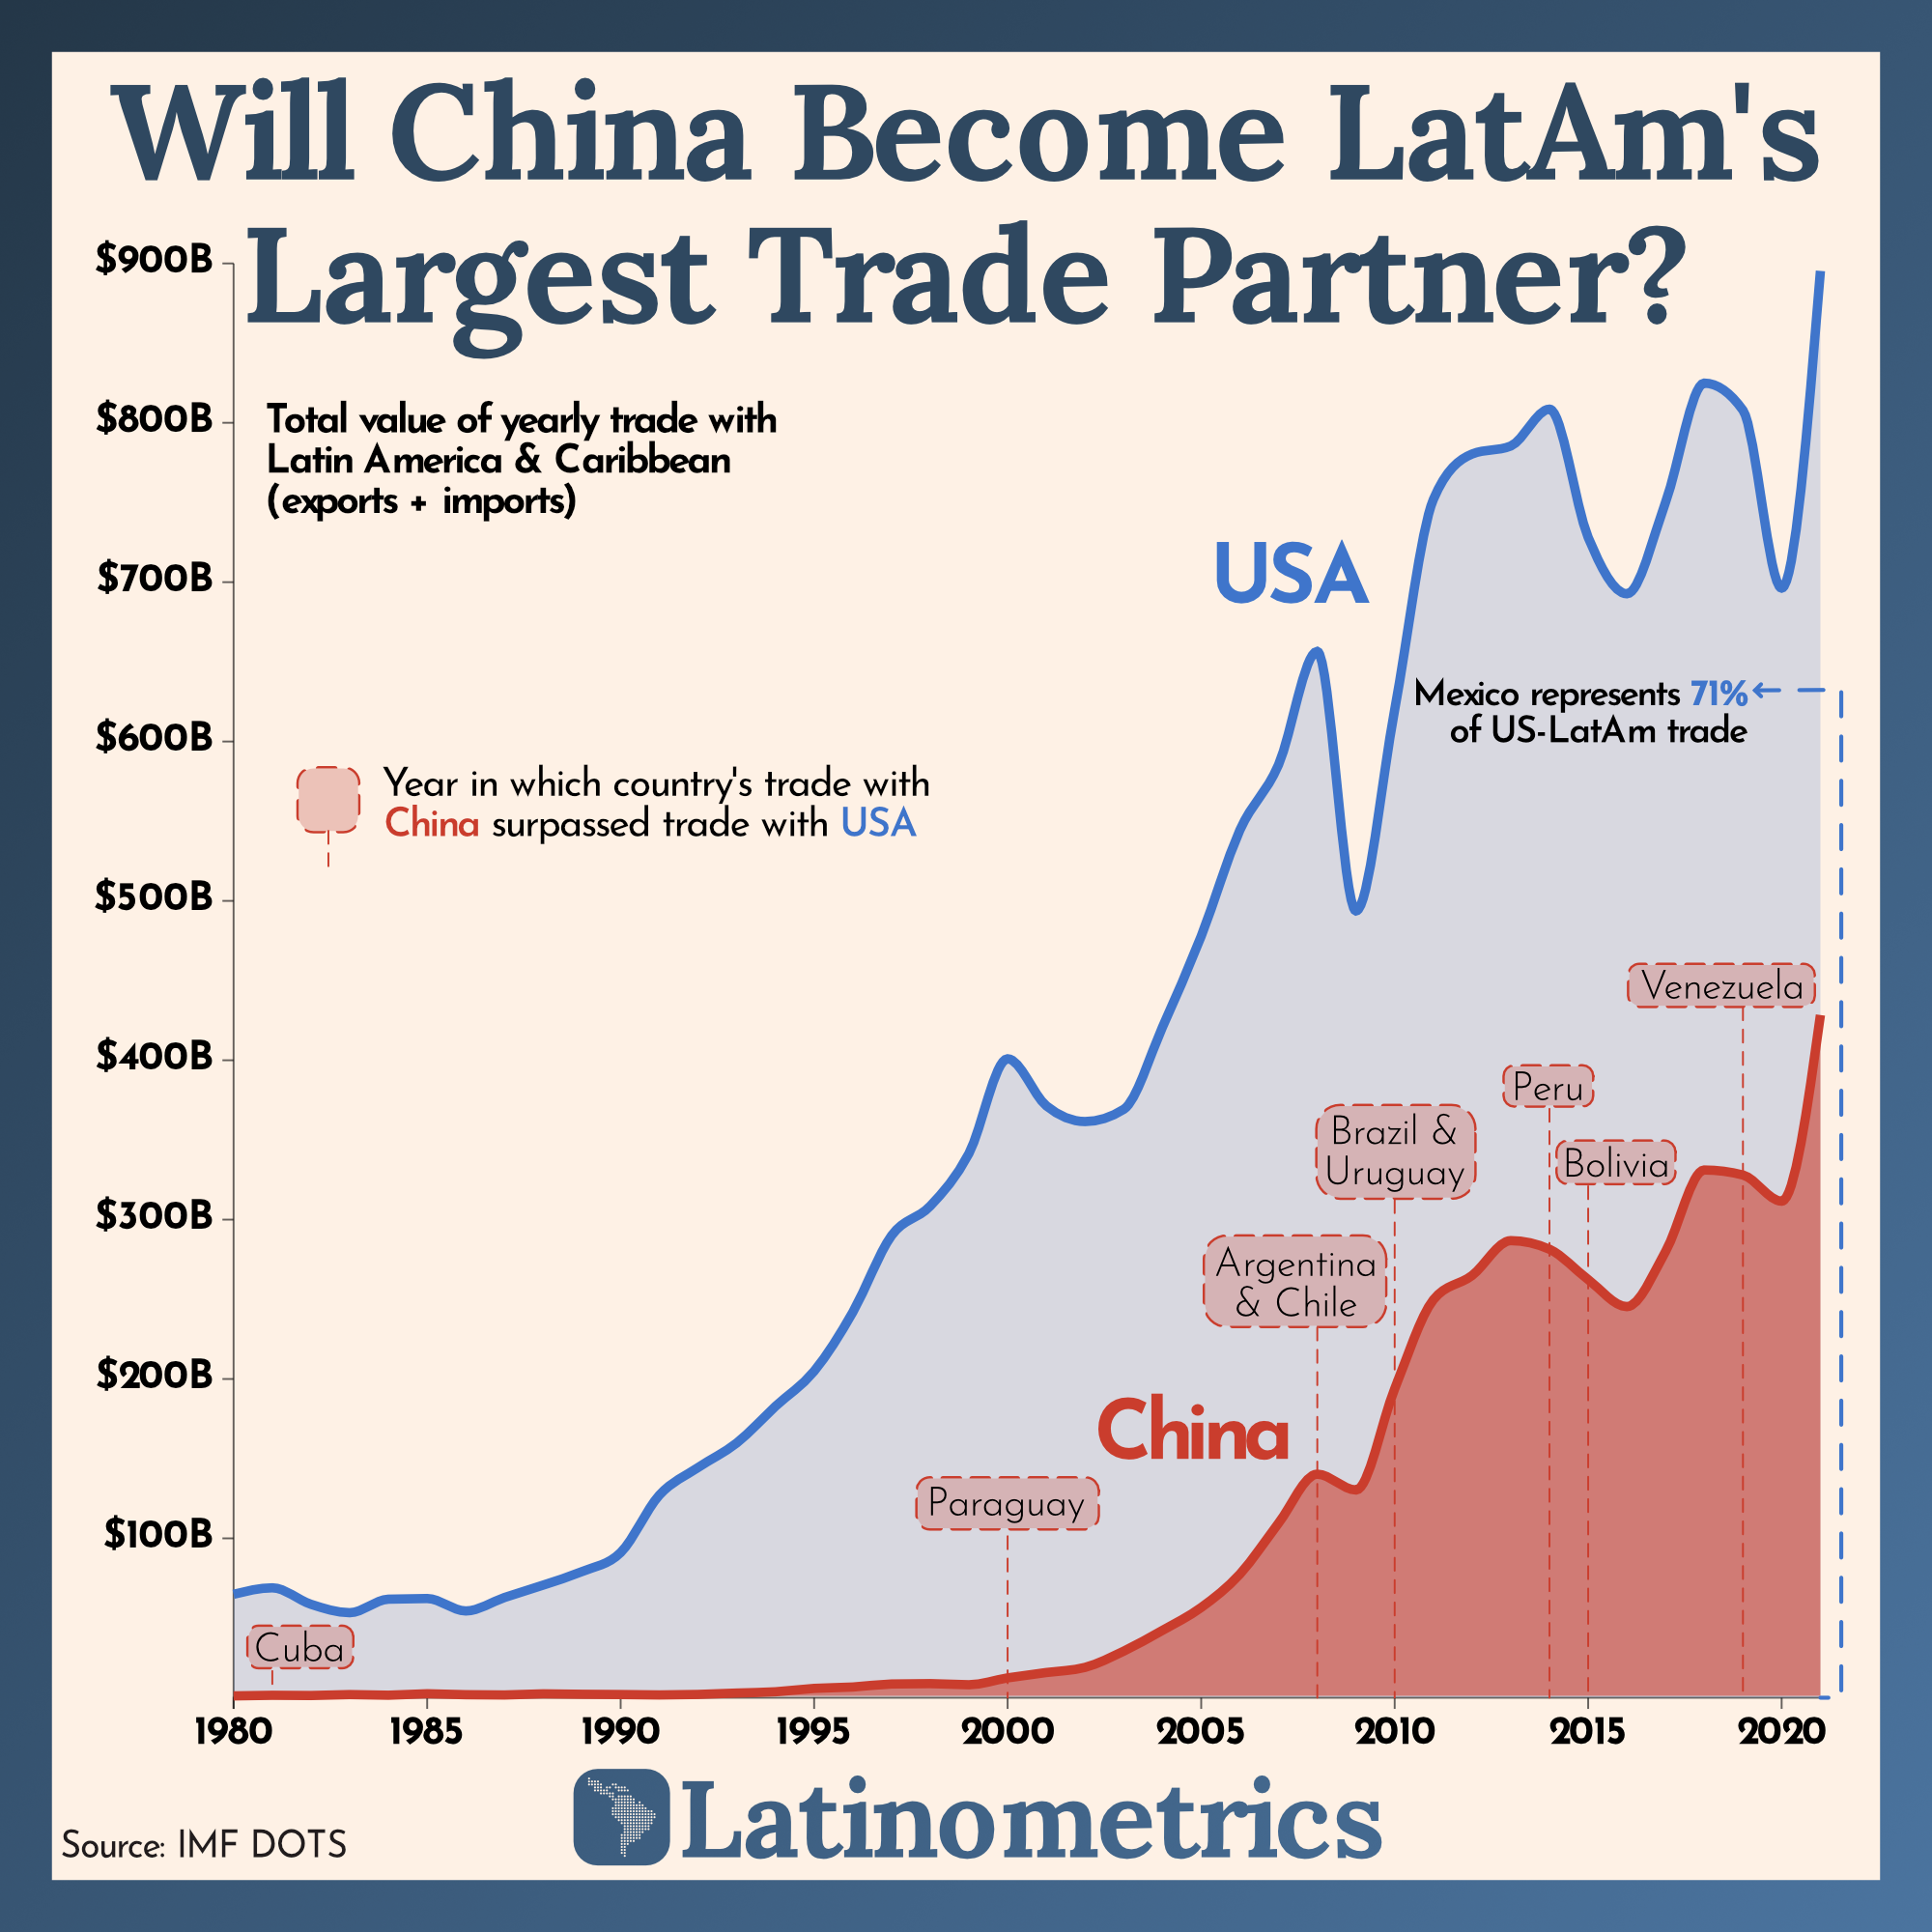
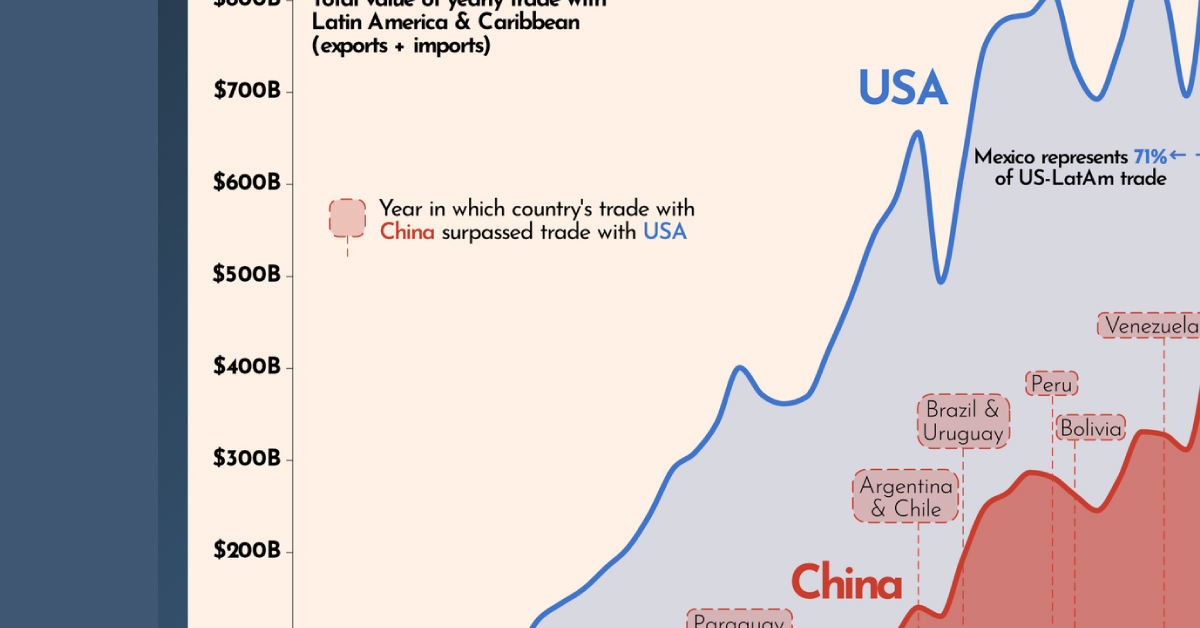
Now, China is one of Latin America’s largest trade partners, which is threatening U.S. dominance in the region. This graphic by Latinometrics uses IMF data to show trade flows between China and Latin America since the 1980s.
Two Decades of Trade Growth
Four decades ago, the United States had a much stronger trade relationship with Latin America than China did. In 1981, Cuba was the only Latin American country trading more with China than the United States.
Here’s a look at total trade flows between Latin America and the two countries since 1980. Latinometrics calculated trade flows as total exports plus imports.
| Trade Flows by Year | U.S. & Latin America | China & Latin America |
|---|---|---|
| 1980 | $64,916.46M | $1,149.20M |
| 1981 | $68,954.16M | $1,524.78M |
| 1982 | $58,601.14M | $1,381.61M |
| 1983 | $53,347.45M | $1,973.34M |
| 1984 | $61,829.84M | $1,573.58M |
| 1985 | $62,241.61M | $2,489.73M |
| 1986 | $54,441.85M | $1,888.88M |
| 1987 | $62,890.00M | $1,721.23M |
| 1988 | $70,673.07M | $2,433.94M |
| 1989 | $79,140.76M | $2,149.71M |
| 1990 | $91,090.09M | $1,997.48M |
| 1991 | $127,120.71M | $1,741.68M |
| 1992 | $144,422.66M | $2,051.77M |
| 1993 | $159,873.67M | $2,923.49M |
| 1994 | $182,872.71M | $3,724.97M |
| 1995 | $204,901.92M | $5,847.65M |
| 1996 | $241,927.58M | $6,711.47M |
| 1997 | $290,032.40M | $8,609.87M |
| 1998 | $308,555.72M | $8,844.21M |
| 1999 | $341,504.58M | $8,138.22M |
| 2000 | $400,901.25M | $12,452.97M |
| 2001 | $371,377.08M | $15,818.76M |
| 2002 | $361,536.31M | $19,033.47M |
| 2003 | $369,218.54M | $29,215.64M |
| 2004 | $420,744.88M | $42,242.20M |
| 2005 | $477,850.02M | $56,609.70M |
| 2006 | $544,418.91M | $77,528.04M |
| 2007 | $585,446.96M | $109,558.66M |
| 2008 | $656,499.37M | $140,274.87M |
| 2009 | $493,741.65M | $130,359.64M |
| 2010 | $619,989.84M | $193,853.31M |
| 2011 | $751,891.79M | $249,708.91M |
| 2012 | $780,401.27M | $264,908.73M |
| 2013 | $785,444.16M | $286,816.10M |
| 2014 | $808,542.96M | $281,412.70M |
| 2015 | $728,071.40M | $262,383.97M |
| 2016 | $692,719.56M | $245,403.45M |
| 2017 | $750,289.25M | $280,072.19M |
| 2018 | $824,877.82M | $331,131.25M |
| 2019 | $807,868.87M | $327,999.75M |
| 2020 | $696,294.90M | $311,584.87M |
| 2021 | $895,309.53M | $428,384.92M |
Things stayed relatively stagnant until the early 2000s. Then suddenly, at the start of the new millennium, trade between China and Latin America started to ramp up.
This uptick was driven largely by Chinese demand for things like copper, oil, and other raw materials that the country needed to help fuel its industrial revolution.
Momentum has continued for two decades, and now China is the top trading partner in nine different Latin American countries. In fact, in 2021, imports and exports between China and Latin America (excluding Mexico) reached $247 billion—that’s $73 billion more than trade flows with the United States that same year.
Trade between China and Latin America is expected to keep growing, at least for the time being. By 2035, trade flows between the two regions are projected to more than double, according to World Economic Forum.
China’s Global Economic Presence
China’s trade takeover of Latin America speaks to a wider trend that’s happening on a global scale—over the last two decades, China has surpassed the U.S. as the world’s largest trading partner.
While China is likely to remain the world’s leading trade partner for the foreseeable future, growth is likely to slow in the short-term, given ongoing supply chain issues and geopolitical tensions that have disrupted the global economy.

This article was published as a part of Visual Capitalist's Creator Program, which features data-driven visuals from some of our favorite Creators around the world.


United States
Ranked: The Largest U.S. Corporations by Number of Employees
We visualized the top U.S. companies by employees, revealing the massive scale of retailers like Walmart, Target, and Home Depot.


The Largest U.S. Corporations by Number of Employees
This was originally posted on our Voronoi app. Download the app for free on Apple or Android and discover incredible data-driven charts from a variety of trusted sources.
Revenue and profit are common measures for measuring the size of a business, but what about employee headcount?
To see how big companies have become from a human perspective, we’ve visualized the top U.S. companies by employees. These figures come from companiesmarketcap.com, and were accessed in March 2024. Note that this ranking includes publicly-traded companies only.
Data and Highlights
The data we used to create this list of largest U.S. corporations by number of employees can be found in the table below.
| Company | Sector | Number of Employees |
|---|---|---|
| Walmart | Consumer Staples | 2,100,000 |
| Amazon | Consumer Discretionary | 1,500,000 |
| UPS | Industrials | 500,000 |
| Home Depot | Consumer Discretionary | 470,000 |
| Concentrix | Information Technology | 440,000 |
| Target | Consumer Staples | 440,000 |
| Kroger | Consumer Staples | 430,000 |
| UnitedHealth | Health Care | 400,000 |
| Berkshire Hathaway | Financials | 383,000 |
| Starbucks | Consumer Discretionary | 381,000 |
| Marriott International | Consumer Discretionary | 377,000 |
| Cognizant | Information Technology | 346,600 |
Retail and Logistics Top the List
Companies like Walmart, Target, and Kroger have a massive headcount due to having many locations spread across the country, which require everything from cashiers to IT professionals.
Moving goods around the world is also highly labor intensive, explaining why UPS has half a million employees globally.
Below the Radar?
Two companies that rank among the largest U.S. corporations by employees which may be less familiar to the public include Concentrix and Cognizant. Both of these companies are B2B brands, meaning they primarily work with other companies rather than consumers. This contrasts with brands like Amazon or Home Depot, which are much more visible among average consumers.
A Note on Berkshire Hathaway
Warren Buffett’s company doesn’t directly employ 383,000 people. This headcount actually includes the employees of the firm’s many subsidiaries, such as GEICO (insurance), Dairy Queen (retail), and Duracell (batteries).
If you’re curious to see how Buffett’s empire has grown over the years, check out this animated graphic that visualizes the growth of Berkshire Hathaway’s portfolio from 1994 to 2022.

-

 Energy1 week ago
The World’s Biggest Nuclear Energy Producers
-

 Money2 weeks ago
Which States Have the Highest Minimum Wage in America?
-

 Technology2 weeks ago
Ranked: Semiconductor Companies by Industry Revenue Share
-

 Markets2 weeks ago
Ranked: The World’s Top Flight Routes, by Revenue
-

 Countries2 weeks ago
Population Projections: The World’s 6 Largest Countries in 2075
-

 Markets2 weeks ago
The Top 10 States by Real GDP Growth in 2023
-

 Demographics2 weeks ago
The Smallest Gender Wage Gaps in OECD Countries
-

 United States2 weeks ago
Where U.S. Inflation Hit the Hardest in March 2024