Misc
Ranked: Most Popular U.S. Undergraduate Degrees (2011–2021)
Article/Editing:
Ranked: Most Popular U.S. Undergraduate Degrees (2011–2021)
In an era of soaring tuition fees and mounting student debt, choosing which undergraduate degree to pursue has become a crucial decision for any aspiring college student. And it always helps to see which way the winds are blowing.
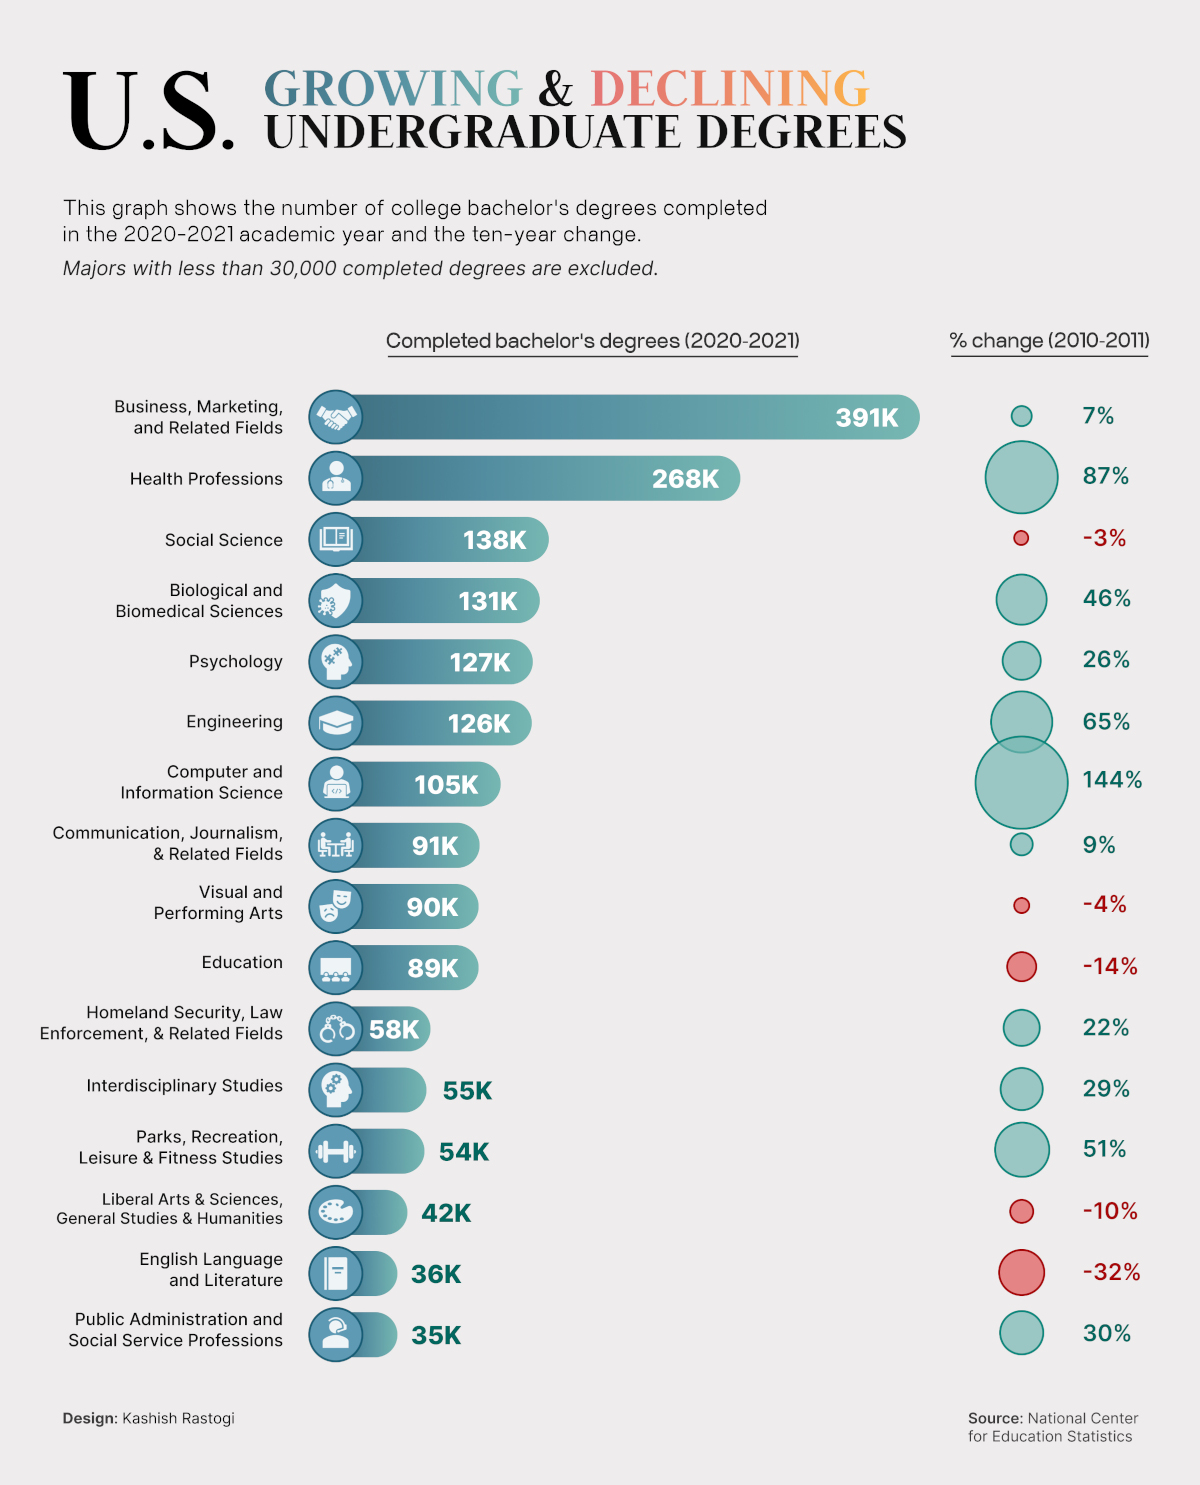
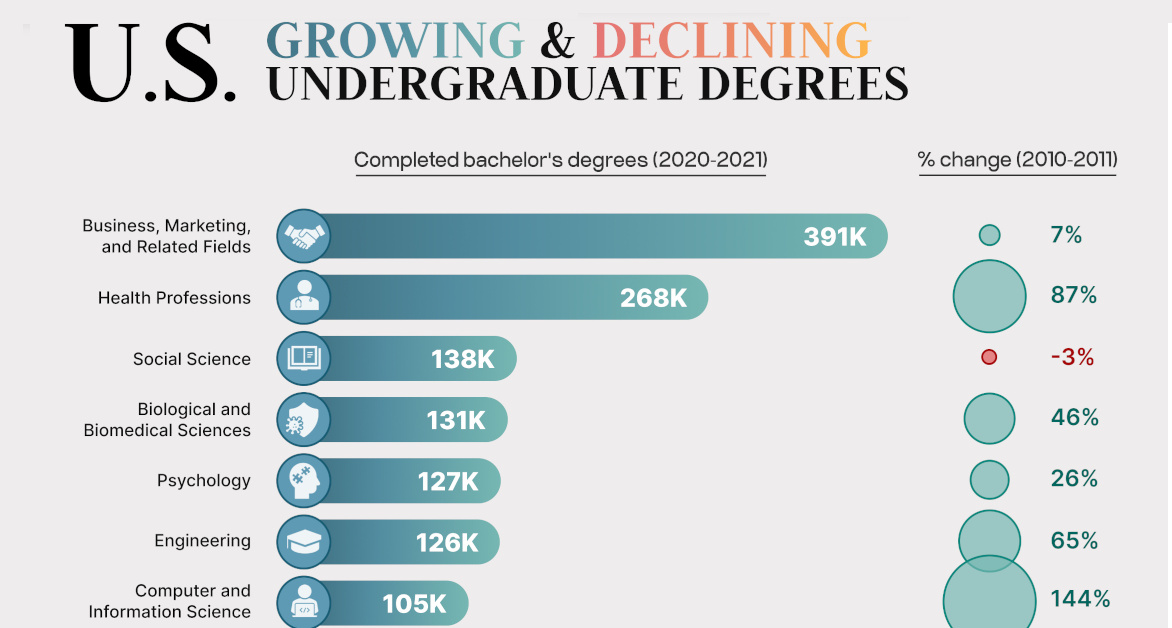
This visualization by Kashish Rastogi, based on data from the National Center for Education Statistics (NCES), examines the changing landscape of undergraduate degrees awarded between the 2010–2011 and 2020–2021 academic years.
Undergraduate Degrees Growing in Popularity
The NCES classifies all four-year bachelor degrees into 38 fields of study. Of these fields, 21 saw an increase in graduates in 2020–2021 compared to 2010–2011.
While only those with more than 30,000 graduates have been shown in the graphic (to prevent overrepresentation of large changes in small pools of graduates), the full list is available below.
| Rank | Field of Study | 2010–2011 | 2020–2021 | % Change |
|---|---|---|---|---|
| 1 | Business | 363,919 | 390,781 | +7% |
| 2 | Health Professions | 143,463 | 268,018 | +87% |
| 3 | Biomedical Sciences | 89,984 | 131,499 | +46% |
| 4 | Psychology | 100,906 | 126,944 | +26% |
| 5 | Engineering | 76,356 | 126,037 | +65% |
| 6 | Computer Sciences | 43,066 | 104,874 | +144% |
| 7 | Communication | 83,231 | 90,775 | +9% |
| 8 | Security & Law Enforcement | 47,600 | 58,009 | +22% |
| 9 | Interdisciplinary Studies | 42,473 | 54,584 | +29% |
| 10 | Leisure & Fitness Studies | 35,934 | 54,294 | +51% |
| 11 | Public Administration | 26,799 | 34,817 | +30% |
| 12 | Physical Sciences | 24,338 | 28,706 | +18% |
| 13 | Mathematics | 17,182 | 27,092 | +58% |
| 14 | Agriculture Sciences | 15,851 | 21,418 | +35% |
| 15 | Natural Resources & Conservation | 12,779 | 20,507 | +61% |
| 16 | Engineering Technologies | 16,187 | 18,562 | +15% |
| 17 | Transportation | 4,941 | 5,993 | +21% |
| 18 | Legal | 4,429 | 4,589 | +4% |
| 19 | Military Technologies | 64 | 1,524 | +2,281% |
| 20 | Science Technologies | 367 | 532 | +45% |
| 21 | Library Science | 96 | 119 | +24% |
Let’s take a look at the areas of study that were most popular, as well as some of the fastest growing fields:
Computer and Information Sciences
Bachelor’s degrees in this discipline have grown by 144% since 2010–2011, with over 100,000 graduates in 2020–2021. The allure of the tech sector’s explosive growth likely contributed to its popularity among students.
Health Professions
Undergraduate degrees in health professions saw an 87% increase, attracting nearly 260,000 graduates in 2020–2021. This field accounted for 13% of the total graduating class, reflecting the growing appeal of the healthcare sector.
Engineering
There were 50,000 more engineering graduates in the U.S. in 2021, up 65% from 2011. With a median income over $100,000 per year, engineering graduates can usually rely on good wages as well as versatility in future careers, capable of finding jobs in tech, design, and communication fields, and of course, becoming future entrepreneurs.
Biomedical Sciences
University graduates in this field, which focuses on the integration of the study of biology with health and medicine, grew by 46%. A subset of this category—epidemiology—has been in the limelight recently thanks to the COVID-19 pandemic.
Business
While this category recorded a modest 7% growth in graduates, its popularity has been indisputable in the last decade, representing the largest proportion of the graduating class in both 2011 and 2021.
Fields with Declining University Graduates (2011‒2021)
Meanwhile, 17 areas of study experienced declines in the number of completed university degrees. We explore some of the notable ones below:
| Rank | Field of Study | 2010–2011 | 2020–2021 | % Change |
|---|---|---|---|---|
| 1 | Social Sciences | 142,161 | 137,908 | -3% |
| 2 | Visual & Performing Arts | 93,939 | 90,022 | -4% |
| 3 | Education | 104,008 | 89,398 | -14% |
| 4 | Liberal Arts | 46,717 | 41,909 | -10% |
| 5 | English | 52,754 | 35,762 | -32% |
| 6 | History | 35,008 | 22,919 | -35% |
| 7 | Human Sciences | 22,438 | 22,319 | -1% |
| 8 | Foreign Languages | 21,705 | 15,518 | -29% |
| 9 | Philosophy & Religion | 12,830 | 11,988 | -7% |
| 10 | Architecture | 9,831 | 9,296 | -5% |
| 11 | Ethnic, Cultural & Gender Studies | 8,955 | 7,374 | -18% |
| 12 | Theology | 9,073 | 6,737 | -26% |
| 13 | Communications Tech | 4,858 | 4,557 | -6% |
| 14 | Personal & Culinary Services | 1,214 | 594 | -51% |
| 15 | Construction Trades | 328 | 221 | -33% |
| 16 | Mechanic & Repair | 226 | 221 | -2% |
| 17 | Precision Production | 43 | 28 | -35% |
English
Popular in the 1970s, the English undergraduate degree has gone through peaks (80s and 90s) and troughs (2000s and 10s) of popularity in the last 50 years. Between 2010–2011 and 2020–2021, the number of students with an English degree has fallen by a third.
The state of English’s woes are even making its way to pop culture, like in Netflix’s The Chair, which follows the head of a struggling English department at a major university.
Education
The existing teacher shortage in the United States does not seem to be getting fixed by a burgeoning supply of new grads. In fact, the number of university graduates in Education fell 14% between 2011 and 2021. With concerns around stagnant wages, burnout, and little to no support for supplies, many teachers are seeing an already demanding job becoming harder.
Liberal Arts
In the classic era, the liberal arts covered seven fields of study: rhetoric, grammar, logic, astronomy, mathematics, geometry, and music. Now, liberal art degrees include several other subjects: history, political science, and even philosophy—but students are meant to primarily walk away with critical thinking skills.
The modern world rewards specialization however, and a wider-scope liberal arts degree is seeing fewer takers, with a 10% drop in graduating students.
Where Does This Data Come From?
Source: The National Center for Education’s statistics from their Integrated Postsecondary Education Data System surveys. Numbers for both 2010–2011 and 2020–2021 academic years can be found from their summary tables by changing the award level code (bachelor degrees) and the year on the left-hand toolbar.

This article was published as a part of Visual Capitalist's Creator Program, which features data-driven visuals from some of our favorite Creators around the world.


Demographics
Mapped: U.S. Immigrants by Region
This map shows which regions U.S. immigrants came from, highlighting Asia and Latin America as the biggest sources.


Breaking Down America’s Immigrant Population
This was originally posted on our Voronoi app. Download the app for free on iOS or Android and discover incredible data-driven charts from a variety of trusted sources.
The United States is home to more immigrants than any other nation, surpassing the combined totals of the next four countries: Germany, Saudi Arabia, Russia, and the United Kingdom.
To add context to this impressive fact, we’ve illustrated the regions from which U.S. immigrants originated. “Immigrants” in this context refers to individuals who are residing in the United States but were not U.S. citizens at birth.
These statistics were sourced from the Migration Policy Institute, which analyzed data from the U.S. Census Bureau’s 2022 American Community Survey (ACS).
U.S. Immigrants by Region
From this graphic, we can see that Asia and Latin America emerge as the primary sources of immigration, collectively accounting for 81% of America’s 46.2 million immigrants.
| Region | # of Immigrants | % of Total |
|---|---|---|
| Europe | 4,728,948 | 10 |
| Asia | 14,349,080 | 31 |
| Africa | 2,752,965 | 6 |
| Oceania | 288,560 | 1 |
| Northern America | 828,702 | 2 |
| Latin America | 23,233,834 | 50 |
| Total | 46,182,089 | 100 |
Latin America alone contributes half of the immigrant population. Mexico stands out as the largest contributor to U.S. immigration, with 10.7 million immigrants, attributable to its geographical proximity and historical ties.
Economic factors, including wage disparity and employment opportunities, drive many Mexicans to seek better prospects north of the border.
From Asia, the two largest country sources are China (2.2 million) and India (2.8 million).
Learn More About U.S. Immigration From Visual Capitalist
If you enjoyed this post, be sure to check out Why Do People Immigrate to the U.S.? This visualization shows the different reasons why immigrants chose to come to America in 2021.

-

 Energy4 days ago
Who’s Building the Most Solar Energy?
-

 Wealth2 weeks ago
Charted: Which Country Has the Most Billionaires in 2024?
-

 Markets2 weeks ago
The Top Private Equity Firms by Country
-

 Jobs1 week ago
The Best U.S. Companies to Work for According to LinkedIn
-

 Economy1 week ago
Ranked: The Top 20 Countries in Debt to China
-

 Misc1 week ago
Charted: Trust in Government Institutions by G7 Countries
-

 Energy1 week ago
Mapped: The Age of Energy Projects in Interconnection Queues, by State
-

 Mining1 week ago
Visualizing Global Gold Production in 2023