Markets
China’s Yuan Devaluation: The Aftermath [Chart]
![China's Yuan Devaluation: The Aftermath [Chart]](https://www.visualcapitalist.com/wp-content/uploads/2015/08/yuan-devaluation-aftermath-chart.jpg)
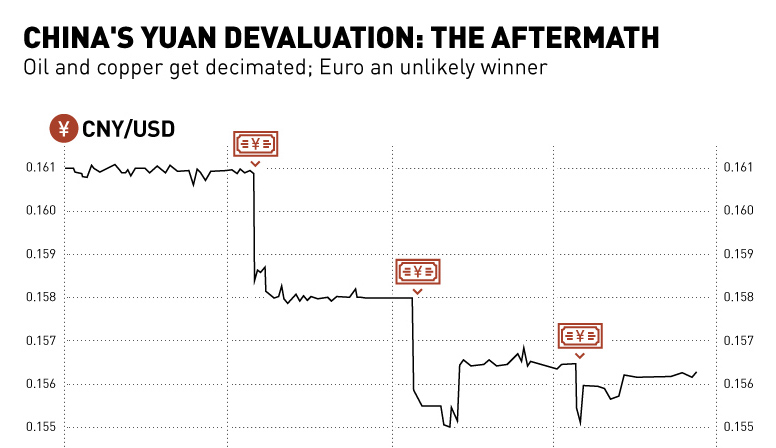
China’s Yuan Devaluation: The Aftermath [Chart]
Oil and copper get decimated; Euro an unlikely winner
The Chart of the Week is a weekly Visual Capitalist feature on Fridays.
Sometimes it feels like the market is one giant ant farm. Investors and traders build all of their little tunnels, and then all of a sudden someone shakes the ant farm causing impending chaos for the hapless ant denizens.
In this case, it was the People’s Bank of China (PBOC) that shook the ant farm – and they did it multiple times this week.
It all started early Tuesday morning as China moved the midpoint of the yuan’s peg by 1.9%, the biggest move since 1994. The PBOC called this change a “one-time adjustment” and said its fixing will now become more aligned with supply and demand. They then proceeded to devalue the yuan two other times throughout the week for a combined 4.4% decrease in value. The Chinese central bank now claims that the yuan will move more according to market forces, which is necessary to get included into the International Monetary Fund’s basket of currency known as Special Drawing Rights (SDR).
We most recently warned about the inevitability of such central bank moves about a month ago, when the Bank of Canada decreased its benchmark rate for the second time in six months. However, it wasn’t until these moves by the PBOC that the market really felt uneasy, and the term “currency war” entered back into the public vernacular.
Investors are clearly shaken up, as all sorts of trading went haywire in the aftermath of the yuan devaluation. Some currencies, like the Canadian dollar, tanked early and then bounced back to take some gains against the USD. The euro fell initially and then bounced back in a big way, gaining 1.8% in the week’s trading. It’s now trading at eight-week highs.
Countries that are inextricably linked to China by regional trade, such as Singapore, Australia, and New Zealand, all had their currencies fall as well. Some emerging markets were also affected strongly, with the Indian rupee dropping -2.3% through the course of the week against the USD.
However, the biggest impact was to commodity prices. A lower yuan means imports are more costly and creates incentive to buy from domestic Chinese producers of base metals and energy. The devaluation was also interpreted by traders as an admission by the Chinese government that the economy is weak, and this helped copper and oil (WTI) tumble. Copper is at its lowest price ($2.35/lb) since the tail-end of the Financial Crisis, and WTI oil continued its worst summer in trading history to end up in a similar position at $42.35/bbl.
Gold is up on the week by about 1%, but it is also bouncing off of its lowest price since 2010.


Markets
Mapped: Europe’s GDP Per Capita, by Country
Which European economies are richest on a GDP per capita basis? This map shows the results for 44 countries across the continent.


Mapped: Europe’s GDP Per Capita, by Country (2024)
This was originally posted on our Voronoi app. Download the app for free on iOS or Android and discover incredible data-driven charts from a variety of trusted sources.
Europe is home to some of the largest and most sophisticated economies in the world. But how do countries in the region compare with each other on a per capita productivity basis?
In this map, we show Europe’s GDP per capita levels across 44 nations in current U.S. dollars. Data for this visualization and article is sourced from the International Monetary Fund (IMF) via their DataMapper tool, updated April 2024.
Europe’s Richest and Poorest Nations, By GDP Per Capita
Luxembourg, Ireland, and Switzerland, lead the list of Europe’s richest nations by GDP per capita, all above $100,000.
| Rank | Country | GDP Per Capita (2024) |
|---|---|---|
| 1 | 🇱🇺 Luxembourg | $131,380 |
| 2 | 🇮🇪 Ireland | $106,060 |
| 3 | 🇨🇭 Switzerland | $105,670 |
| 4 | 🇳🇴 Norway | $94,660 |
| 5 | 🇮🇸 Iceland | $84,590 |
| 6 | 🇩🇰 Denmark | $68,900 |
| 7 | 🇳🇱 Netherlands | $63,750 |
| 8 | 🇸🇲 San Marino | $59,410 |
| 9 | 🇦🇹 Austria | $59,230 |
| 10 | 🇸🇪 Sweden | $58,530 |
| 11 | 🇧🇪 Belgium | $55,540 |
| 12 | 🇫🇮 Finland | $55,130 |
| 13 | 🇩🇪 Germany | $54,290 |
| 14 | 🇬🇧 UK | $51,070 |
| 15 | 🇫🇷 France | $47,360 |
| 16 | 🇦🇩 Andorra | $44,900 |
| 17 | 🇲🇹 Malta | $41,740 |
| 18 | 🇮🇹 Italy | $39,580 |
| 19 | 🇨🇾 Cyprus | $37,150 |
| 20 | 🇪🇸 Spain | $34,050 |
| 21 | 🇸🇮 Slovenia | $34,030 |
| 22 | 🇪🇪 Estonia | $31,850 |
| 23 | 🇨🇿 Czech Republic | $29,800 |
| 24 | 🇵🇹 Portugal | $28,970 |
| 25 | 🇱🇹 Lithuania | $28,410 |
| 26 | 🇸🇰 Slovakia | $25,930 |
| 27 | 🇱🇻 Latvia | $24,190 |
| 28 | 🇬🇷 Greece | $23,970 |
| 29 | 🇭🇺 Hungary | $23,320 |
| 30 | 🇵🇱 Poland | $23,010 |
| 31 | 🇭🇷 Croatia | $22,970 |
| 32 | 🇷🇴 Romania | $19,530 |
| 33 | 🇧🇬 Bulgaria | $16,940 |
| 34 | 🇷🇺 Russia | $14,390 |
| 35 | 🇹🇷 Türkiye | $12,760 |
| 36 | 🇲🇪 Montenegro | $12,650 |
| 37 | 🇷🇸 Serbia | $12,380 |
| 38 | 🇦🇱 Albania | $8,920 |
| 39 | 🇧🇦 Bosnia & Herzegovina | $8,420 |
| 40 | 🇲🇰 North Macedonia | $7,690 |
| 41 | 🇧🇾 Belarus | $7,560 |
| 42 | 🇲🇩 Moldova | $7,490 |
| 43 | 🇽🇰 Kosovo | $6,390 |
| 44 | 🇺🇦 Ukraine | $5,660 |
| N/A | 🇪🇺 EU Average | $44,200 |
Note: Figures are rounded.
Three Nordic countries (Norway, Iceland, Denmark) also place highly, between $70,000-90,000. Other Nordic peers, Sweden and Finland rank just outside the top 10, between $55,000-60,000.
Meanwhile, Europe’s biggest economies in absolute terms, Germany, UK, and France, rank closer to the middle of the top 20, with GDP per capitas around $50,000.
Finally, at the end of the scale, Eastern Europe as a whole tends to have much lower per capita GDPs. In that group, Ukraine ranks last, at $5,660.
A Closer Look at Ukraine
For a broader comparison, Ukraine’s per capita GDP is similar to Iran ($5,310), El Salvador ($5,540), and Guatemala ($5,680).
According to experts, Ukraine’s economy has historically underperformed to expectations. After the fall of the Berlin Wall, the economy contracted for five straight years. Its transition to a Western, liberalized economic structure was overshadowed by widespread corruption, a limited taxpool, and few revenue sources.
Politically, its transformation from authoritarian regime to civil democracy has proved difficult, especially when it comes to institution building.
Finally, after the 2022 invasion of the country, Ukraine’s GDP contracted by 30% in a single year—the largest loss since independence. Large scale emigration—to the tune of six million refugees—is also playing a role.
Despite these challenges, the country’s economic growth has somewhat stabilized while fighting continues.

-

 Markets7 days ago
The Most Valuable Companies in Major EU Economies
-

 Wealth2 weeks ago
Charted: Which City Has the Most Billionaires in 2024?
-

 Technology2 weeks ago
All of the Grants Given by the U.S. CHIPS Act
-

 Green2 weeks ago
The Carbon Footprint of Major Travel Methods
-

 United States2 weeks ago
Visualizing the Most Common Pets in the U.S.
-

 Culture2 weeks ago
The World’s Top Media Franchises by All-Time Revenue
-

 voronoi1 week ago
Best Visualizations of April on the Voronoi App
-

 Wealth1 week ago
Charted: Which Country Has the Most Billionaires in 2024?