Mining
All the Metals We Mined in 2021: Visualized
![]() Subscribe to the Elements free mailing list for more like this
Subscribe to the Elements free mailing list for more like this
View the full-size infographic
All the Metals We Mined in 2021
This was originally posted on Elements. Sign up to the free mailing list to get beautiful visualizations on natural resource megatrends in your email every week.
“If you can’t grow it, you have to mine it” is a famous saying that encapsulates the importance of minerals and metals in the modern world.
From every building we enter to every device we use, virtually everything around us contains some amount of metal.
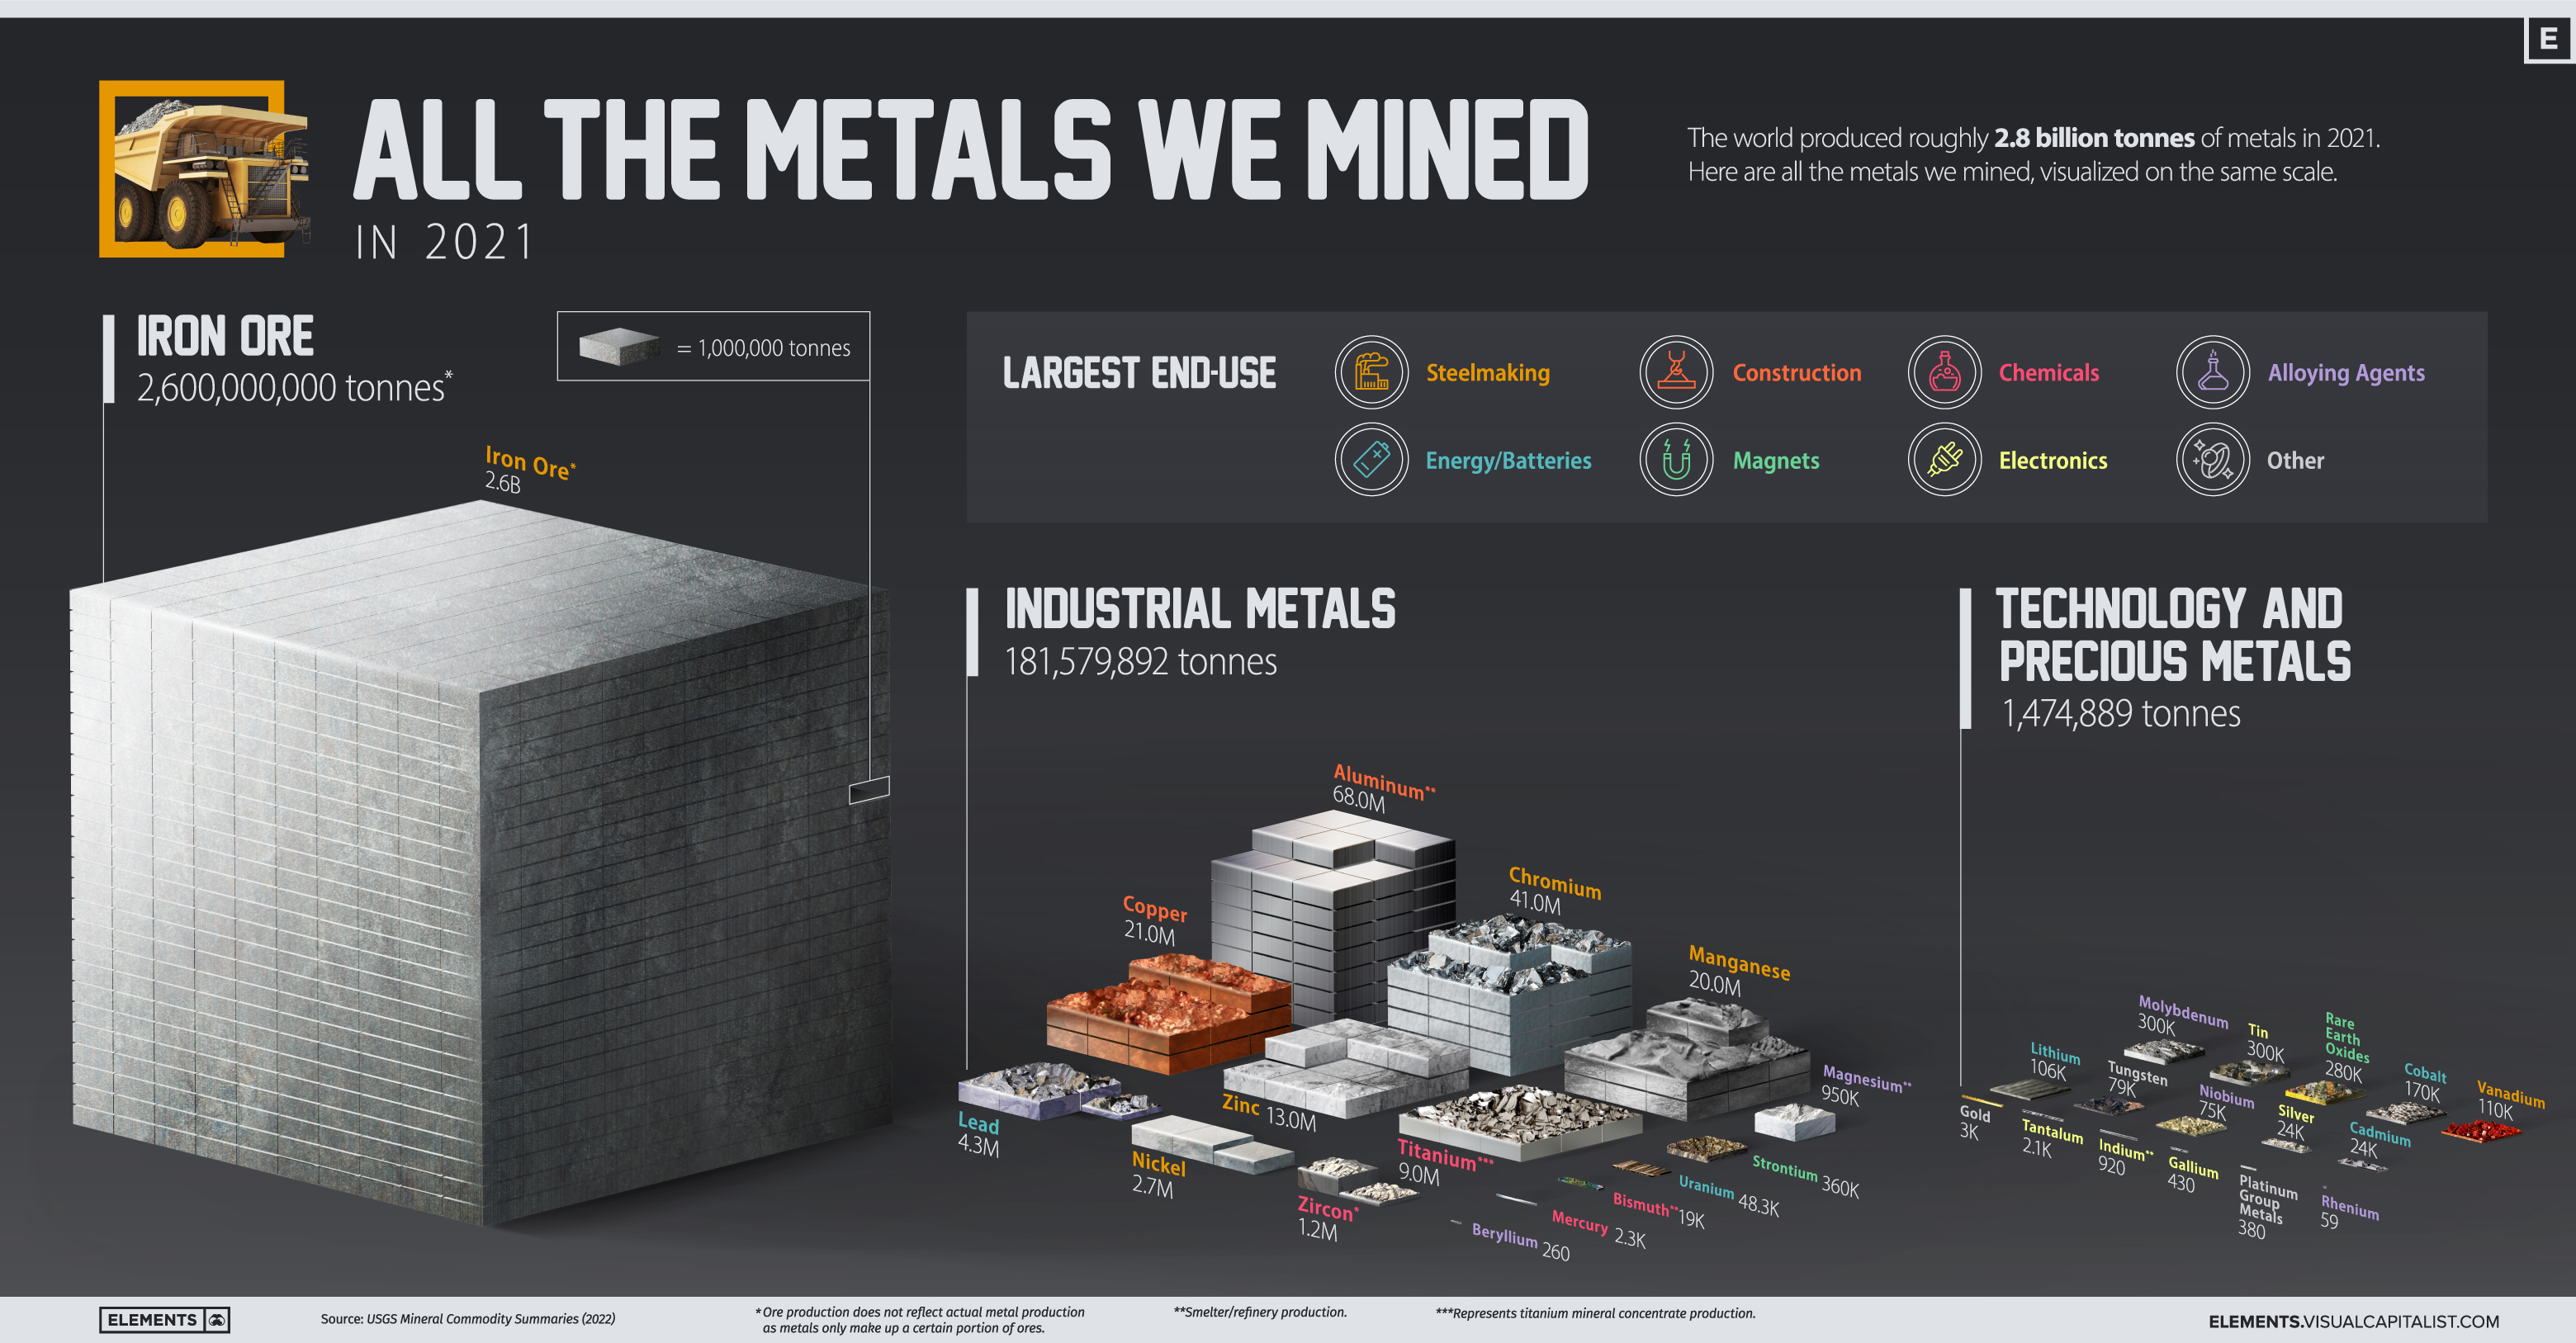
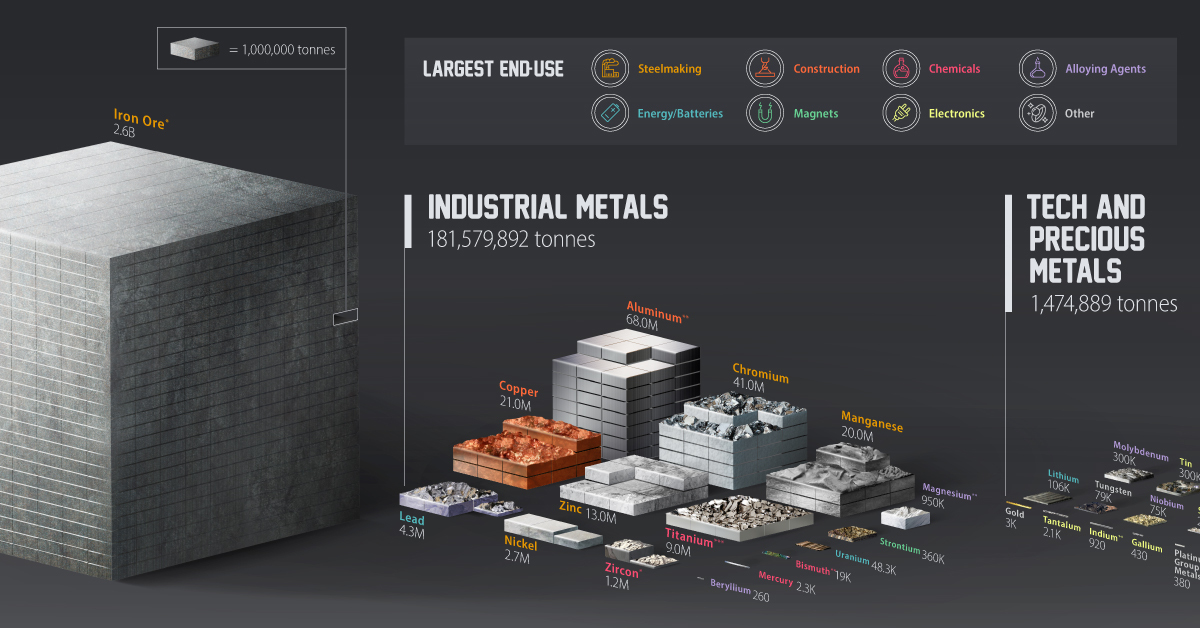
The above infographic visualizes all 2.8 billion tonnes of metals mined in 2021 and highlights each metal’s largest end-use using data from the United States Geological Survey (USGS).
Why Do We Mine So Much Iron Ore?
Iron ore accounted for 93% of the metals mined in 2021, with 2.6 billion tonnes extracted from the ground. It’s important to note that this is ore production, which is typically higher than metal production since metals are extracted and refined from ores. For example, the iron metal content of this ore is estimated at 1.6 billion tonnes.
| Metal/Ore | 2021 Mine Production (tonnes) | % of Total |
|---|---|---|
| Iron ore | 2,600,000,000 | 93.4% |
| Industrial metals | 181,579,892 | 6.5% |
| Technology and precious metals | 1,474,889 | 0.05% |
| Total | 2,783,054,781 | 100.0% |
With 98% of it converted into pig iron to make steel, iron ore is ubiquitous in our lives. Steel made from iron ore is used in construction, transportation, and household appliances, and it’s likely that you encounter something made out of it every day, especially if you live in a city.
Due to its key role in building infrastructure, iron ore is one of the most important materials supporting urbanization and economic growth.
Industrial Metals
Industrial metals are largely used in steelmaking, construction, chemical manufacturing, and as alloying agents. In 2021, the world mined over 181 million tonnes of these metals.
| Industrial Metals | 2021 Mine Production (tonnes) | % of Total |
|---|---|---|
| Aluminum* | 68,000,000 | 37.4% |
| Chromium | 41,000,000 | 22.6% |
| Copper | 21,000,000 | 11.6% |
| Manganese | 20,000,000 | 11.0% |
| Zinc | 13,000,000 | 7.2% |
| Titanium (mineral concentrates) | 9,000,000 | 5.0% |
| Lead | 4,300,000 | 2.4% |
| Nickel | 2,700,000 | 1.5% |
| Zirconium Minerals (Zircon) | 1,200,000 | 0.7% |
| Magnesium* | 950,000 | 0.5% |
| Strontium | 360,000 | 0.2% |
| Uranium | 48,332 | 0.03% |
| Bismuth* | 19,000 | 0.01% |
| Mercury | 2,300 | 0.001% |
| Beryllium | 260 | 0.0001% |
| Total | 181,579,892 | 100.0% |
*Represents refinery/smelter production.
Aluminum accounted for nearly 40% of industrial metal production in 2021. China was by far the largest aluminum producer, making up more than half of global production. The construction industry uses roughly 25% of annually produced aluminum, with 23% going into transportation.
Chromium is a lesser-known metal with a key role in making stainless steel stainless. In fact, stainless steel is usually composed of 10% to 30% of chromium, enhancing its strength and corrosion resistance.
Copper, manganese, and zinc round out the top five industrial metals mined in 2021, each with its own unique properties and roles in the economy.
Technology and Precious Metals
Technology metals include those that are commonly used in technology and devices. Compared to industrial metals, these are usually mined on a smaller scale and could see faster consumption growth as the world adopts new technologies.
| Technology and Precious Metals | 2021 Mine Production (tonnes) | % of Total |
|---|---|---|
| Tin | 300,000 | 20.3% |
| Molybdenum | 300,000 | 20.3% |
| Rare Earth Oxides | 280,000 | 19.0% |
| Cobalt | 170,000 | 11.5% |
| Vanadium | 110,000 | 7.5% |
| Lithium | 106,000 | 7.2% |
| Tungsten | 79,000 | 5.4% |
| Niobium | 75,000 | 5.1% |
| Silver | 24,000 | 1.6% |
| Cadmium | 24,000 | 1.6% |
| Gold | 3,000 | 0.2% |
| Tantalum | 2,100 | 0.1% |
| Indium* | 920 | 0.1% |
| Gallium | 430 | 0.03% |
| Platinum Group Metals | 380 | 0.03% |
| Rhenium | 59 | 0.004% |
| Total | 1,474,889 | 100.0% |
*Represents refinery/smelter production.
The major use of rhenium, one of the rarest metals in terms of production, is in superalloys that are critical for engine turbine blades in aircraft and gas turbine engines. The petroleum industry uses it in rhenium-platinum catalysts to produce high-octane gasoline for vehicles.
In terms of growth, clean energy technology metals stand out. For example, lithium production has more than doubled since 2016 and is set to ride the boom in EV battery manufacturing. Over the same period, global rare earth production more than doubled, driven by the rising demand for magnets.
Indium is another interesting metal on this list. Most of it is used to make indium tin oxide, an important component of touchscreens, TV screens, and solar panels.
The Metal Mining Megatrend
The world’s material consumption has grown significantly over the last few decades, with growing economies and cities demanding more resources.
Global production of both iron ore and aluminum has more than tripled relative to the mid-1990s. Other metals, including copper and steel, have also seen significant consumption growth.
Today, economies are not only growing and urbanizing but also adopting mineral-intensive clean energy technologies, pointing towards further increases in metal production and consumption.


Mining
Visualizing Global Gold Production in 2023
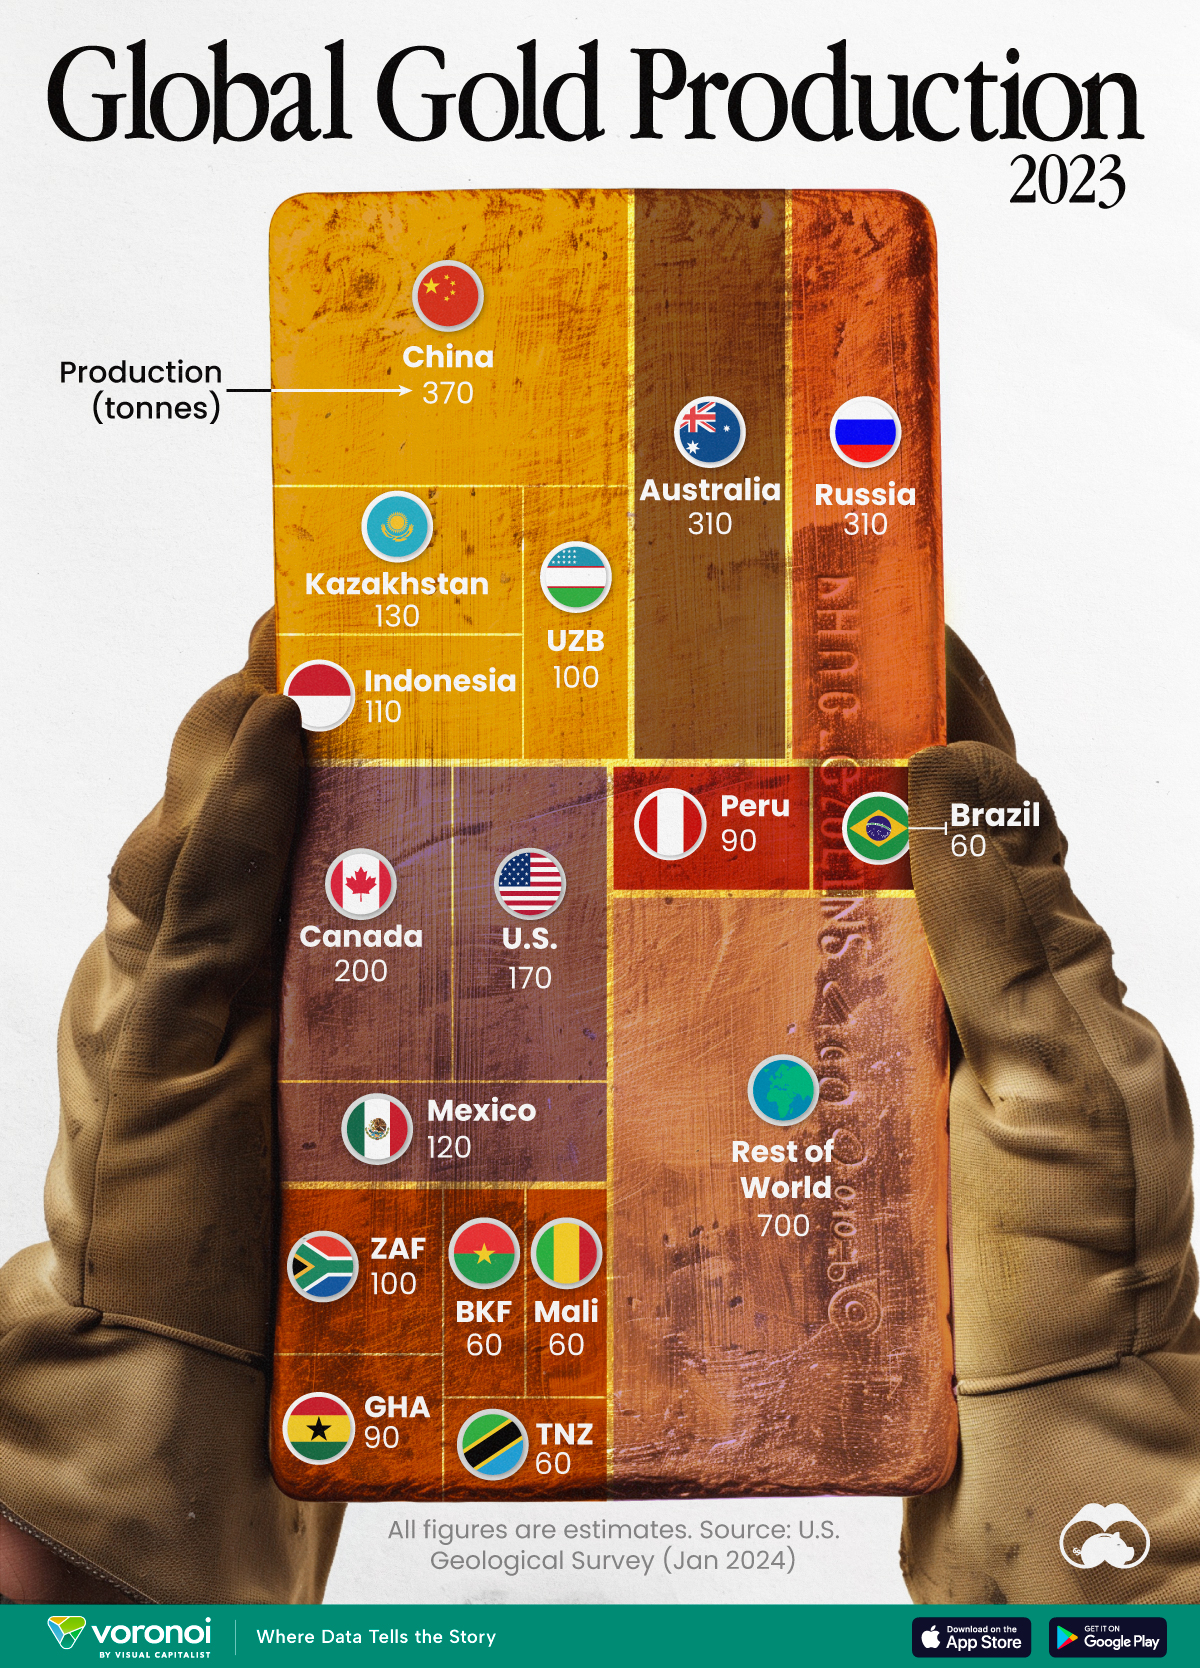
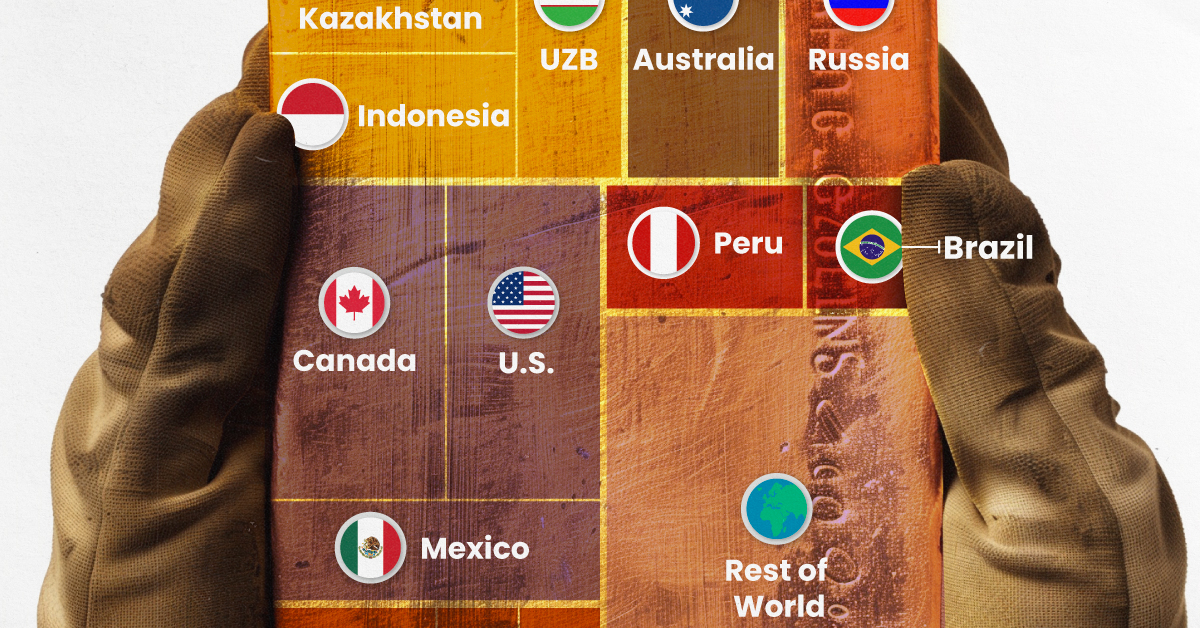
Gold production in 2023 was led by China, Australia, and Russia, with each outputting over 300 tonnes.
Visualizing Global Gold Production in 2023
This was originally posted on our Voronoi app. Download the app for free on iOS or Android and discover incredible data-driven charts from a variety of trusted sources.
Over 3,000 tonnes of gold were produced globally in 2023.
In this graphic, we list the world’s leading countries in terms of gold production. These figures come from the latest USGS publication on gold statistics (published January 2024).
China, Australia, and Russia Produced the Most Gold in 2023
China was the top producer in 2023, responsible for over 12% of total global production, followed by Australia and Russia.
| Country | Region | 2023E Production (tonnes) |
|---|---|---|
| 🇨🇳 China | Asia | 370 |
| 🇦🇺 Australia | Oceania | 310 |
| 🇷🇺 Russia | Europe | 310 |
| 🇨🇦 Canada | North America | 200 |
| 🇺🇸 United States | North America | 170 |
| 🇰🇿 Kazakhstan | Asia | 130 |
| 🇲🇽 Mexico | North America | 120 |
| 🇮🇩 Indonesia | Asia | 110 |
| 🇿🇦 South Africa | Africa | 100 |
| 🇺🇿 Uzbekistan | Asia | 100 |
| 🇬🇭 Ghana | Africa | 90 |
| 🇵🇪 Peru | South America | 90 |
| 🇧🇷 Brazil | South America | 60 |
| 🇧🇫 Burkina Faso | Africa | 60 |
| 🇲🇱 Mali | Africa | 60 |
| 🇹🇿 Tanzania | Africa | 60 |
| 🌍 Rest of World | - | 700 |
Gold mines in China are primarily concentrated in eastern provinces such as Shandong, Henan, Fujian, and Liaoning. As of January 2024, China’s gold mine reserves stand at an estimated 3,000 tonnes, representing around 5% of the global total of 59,000 tonnes.
In addition to being the top producer, China emerged as the largest buyer of the yellow metal for the year. In fact, the country’s central bank alone bought 225 tonnes of gold in 2023, according the World Gold Council.
Estimated Global Gold Consumption
Most of the gold produced in 2023 was used in jewelry production, while another significant portion was sold as a store of value, such as in gold bars or coins.
- Jewelry: 46%
- Central Banks and Institutions: 23%
- Physical Bars: 16%
- Official Coins, Medals, and Imitation Coins: 9%
- Electrical and Electronics: 5%
- Other: 1%
According to Fitch Solutions, over the medium term (2023-2032), global gold mine production is expected to grow 15%, as high prices encourage investment and output.

-

 Business6 days ago
The Top Private Equity Firms by Country
-

 Countries2 weeks ago
Countries With the Largest Happiness Gains Since 2010
-

 VC+2 weeks ago
VC+: Get Our Key Takeaways From the IMF’s World Economic Outlook
-

 Demographics2 weeks ago
The Countries That Have Become Sadder Since 2010
-

 Money2 weeks ago
Charted: Who Has Savings in This Economy?
-

 Technology2 weeks ago
Visualizing AI Patents by Country
-

 Economy2 weeks ago
Economic Growth Forecasts for G7 and BRICS Countries in 2024
-

 Wealth1 week ago
Charted: Which City Has the Most Billionaires in 2024?