Markets
29 Things to Look For in a Microcap Stock

29 Things to Look For in a Microcap Stock
Today’s infographic corresponds with the Howard Group’s Opportunity Knocks Challenge, which we are proud to sponsor. In this free challenge, investors can pick a portfolio of stocks from the public companies they represent – with play money of course. The investor with the best performing portfolio wins the trip of a lifetime valued between $11,000 and $15,000.
There are some incredible trips available:
- Head to Pamplona to literally run with the bulls
- Race Ferraris and Lambos in Vegas
- Visit exotic Vietnam and Cambodia for a river cruise
- Take a bite of a the Big Apple with a big shopping spree
- Hit the famous Wailea Golf Club in Maui for a few rounds
Definitely consider registering for this free contest today. We want to see a Visual Capitalist reader as the winner!
The Microcap Opportunity
We worked with Howard Group to come up with 29 points to consider when looking at investing in a microcap stock. The key here is due diligence. Good research can help you mitigate the risks that these stocks have.
Benefits of microcaps:
- Higher potential returns
- Small companies outperform big companies over time
- Valuation disconnect
- Lack of visibility = higher arbitrage
- Nimble companies and boards
- M&A potential
Downsides of microcaps:
- Higher risk
- Less analyst coverage = less due diligence by market
- Less trading volume
Investors who do strong due diligence can mitigate the downsides to trading microcaps and can reap big gains.
Due Diligence Checklist
The People
Good people behind a company make a difference – especially for small companies that have big growth potential.
Here are the key things to look for:
- A proven track record in building successful businesses
- A well-established network of connections and ability to nurture strategic relations
- Ability to raise capital in a tough economic environment
- Skin in the game: ownership of shares of the company represents real stake
- Management that is respectful of shareholder funds: not spending excessive money on General and Administrative (G&A) expenses or overpaying themselves
Pro tip: Review annual Information Circular for excessive levels of management compensation or director’s fees, insider shareholdings, any past bankruptcies, and other Boards that senior officers serve on or previously sat as a director.
Capital Structure
The structure of microcaps can tell a story on its own. Here is what to look for:
- The percentage of holdings of retail vs institutional investors, as well as insiders
- How many shares are outstanding and fully diluted
- The expiry dates and strike prices of warrants
Pro Tip: Look at previous financings. Was each subsequent financing done at a higher level than the last? Or does the company have a history of dilution?
The Numbers
The numbers are the meat and potatoes of this checklist. Look at:
- Working capital
- Quarterly expenses with special attention to G&A
- Debt – repayment schedule and interest rates
- Generating free cash flow, or the potential to do so in the near future
- Ability to maintain profitable margins
Pro Tip: Are revenues based on the one-time sale of a product or is there a strong recurring revenue model?
Differentiators and Catalysts
Does the company have an advantage over competitors? What catalysts are on the horizon that could potential impact share price?
- What sets the company apart from its peers?
- Product features, attributes and benefits
- Service features, attributes and benefits
- The company’s client list
- Visibility on events or milestones that will bring significant shareholder value
Pro Tip: Look at management’s past performance to see if they have done what they said they’d do. Have they met the timelines and objectives previously stated?
Valuation:
Relative to the market, is this company fairly valued? Check out:
- For a revenue producing company: how much future potential is built into the stock price versus the fundamental financial situation.
- For a non-revenue producing company: how much potential is built into the ultimate value of the asset and its economic viability
Tricks of the Trade:
Don’t bite off more than you can chew. Could you sell your holdings within three trading days without incurring a loss greater than 10%?
Keep an eye on the insiders. Insiders know the internal workings of the company and buying or selling could be a signal.
Watch the stock like a hawk. A sudden price drop could indicate a pending financing or negative news.
Analyze the analysts. Watch what the analysts are saying and if their opinions are shifting.


Markets
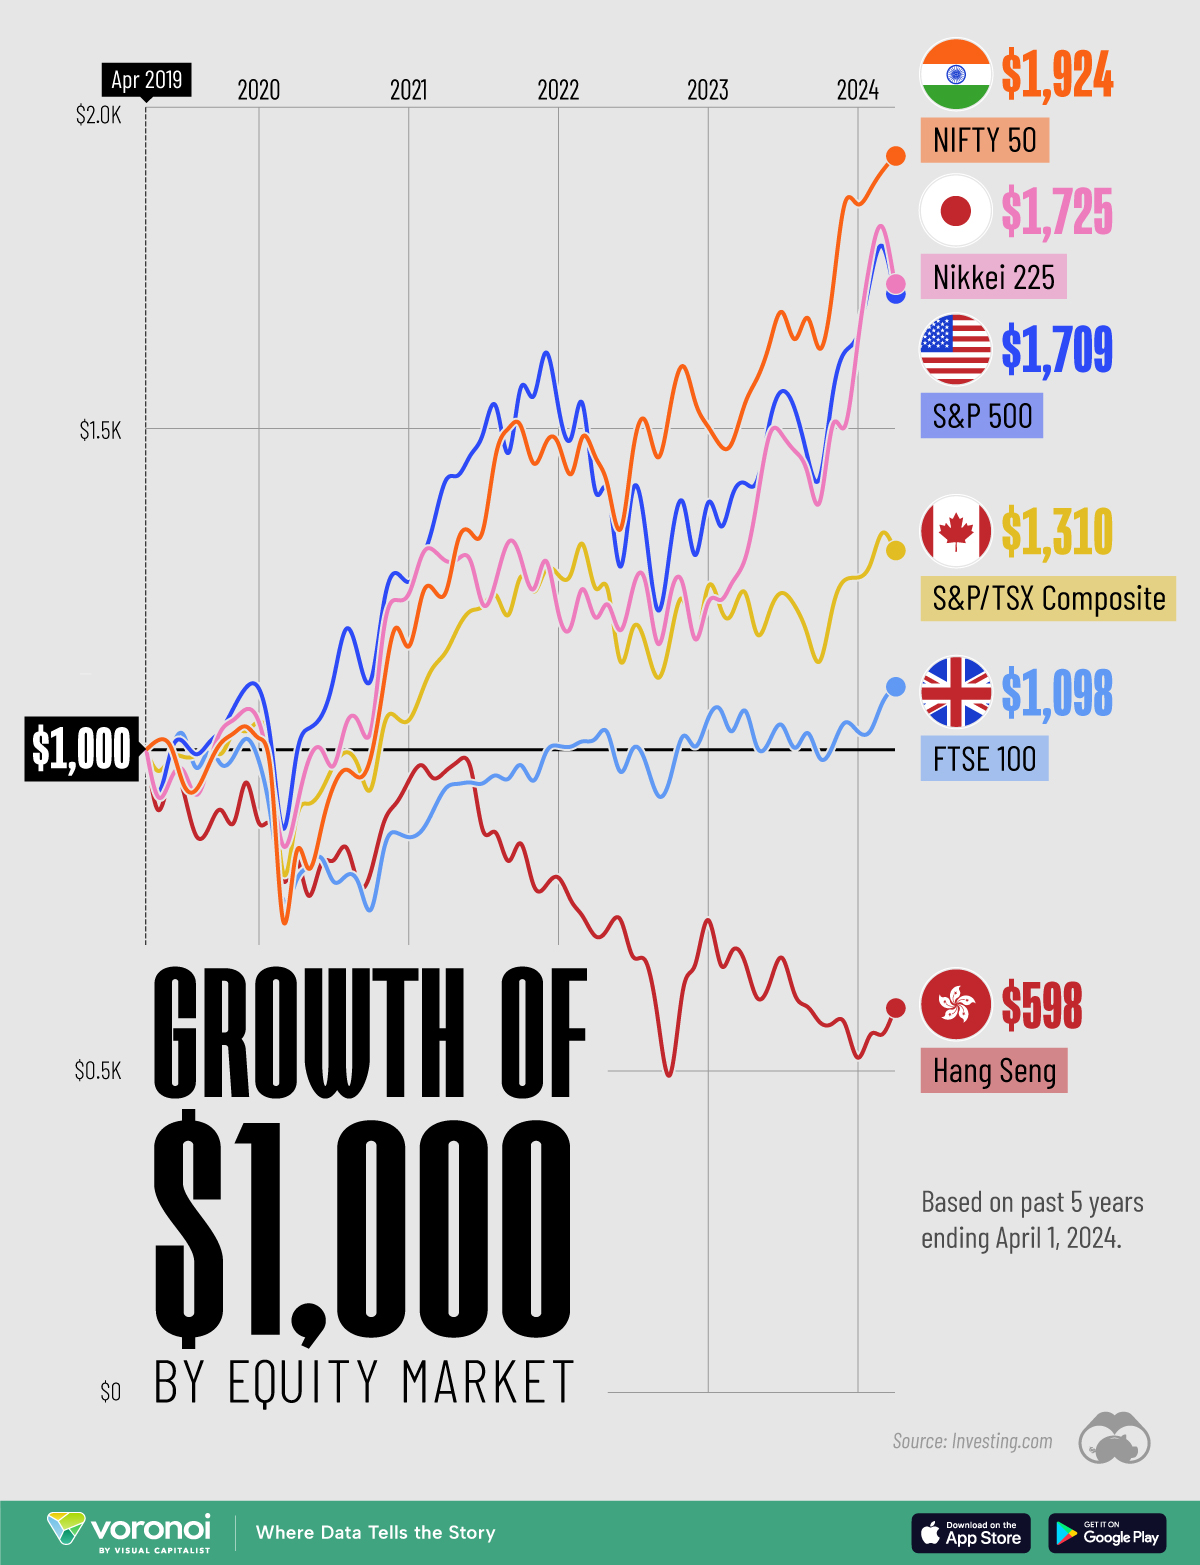
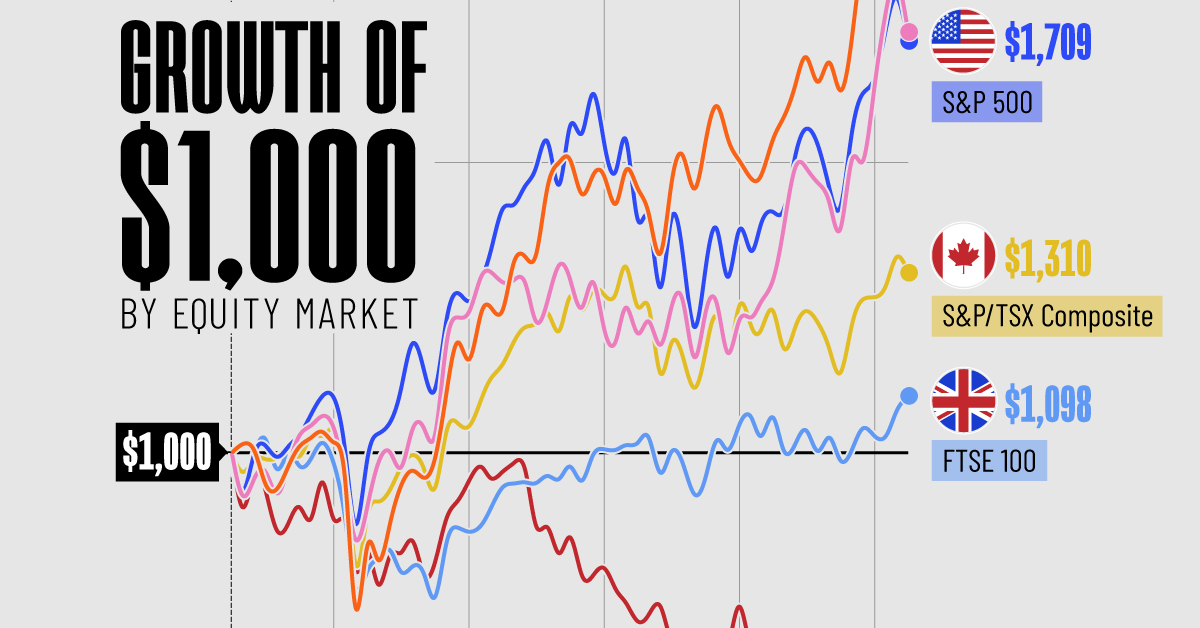
The Growth of a $1,000 Equity Investment, by Stock Market
In this graphic, we’ve visualized stock market growth by country over the past five years using major indices.
Visualizing Stock Market Growth by Country
This was originally posted on our Voronoi app. Download the app for free on iOS or Android and discover incredible data-driven charts from a variety of trusted sources.
In this graphic, we show the change in value of a $1,000 investment in various leading equity indexes from around the world. This data was sourced from Investing.com, and covers a five-year period from April 2019 to April 2024.
See the following table for the five-year annual return figures of the indexes shown above.
| Index | 5-Yr Return as of April 1, 2024 |
|---|---|
| 🇮🇳 NIFTY 50 | 92.4% |
| 🇯🇵 Nikkei 225 | 72.5% |
| 🇺🇸 S&P 500 | 70.9% |
| 🇨🇦 S&P/TSX Composite | 31.0% |
| 🇬🇧 FTSE 100 | 9.8% |
| 🇭🇰 Hang Seng | -40.2% |
In terms of stock market growth by country, India (represented here by the NIFTY 50) has impressively surpassed both the U.S. and Japan.
What is the NIFTY 50?
The NIFTY 50 is an index of the 50 largest and most actively traded Indian stocks. Similar to the S&P 500, it represents a range of industries and acts as a benchmark for investors to gauge the performance of the country’s broader stock market.
What’s Going on in India?
India’s multi-year bull market has led to several records being shattered in 2023. For example, the country’s total stock market market capitalization surpassed $4 trillion for the first time, while India-focused ETFs pulled in net inflows of $8.6 billion over the year.
A primary driver of this growth is the country’s fast-rising middle class. According to a report by Morgan Stanley, this “once-in-a-generation shift” will result in India having the third largest stock market globally by 2030, presumably behind the U.S. and China.
Japan Also Breaks Records
Japanese equities (represented in this graphic by the Nikkei 225) slightly outperformed the S&P 500 over the past five years. The index, which represents the top 225 companies on the Tokyo Stock Exchange, recently set a new record high for the first time since 1989.
Japanese companies have reported strong earnings as of late, partly thanks to a weak yen, which benefits many of the country’s export-reliant companies.
Learn More About Global Markets From Visual Capitalist
If you enjoyed this graphic, be sure to check out The World’s Biggest Stock Markets, by Country, which provides a unique perspective on country-level market capitalizations.

-

 Energy6 days ago
Mapped: The Age of Energy Projects in Interconnection Queues, by State
-

 AI2 weeks ago
Visualizing AI Patents by Country
-

 Markets2 weeks ago
Economic Growth Forecasts for G7 and BRICS Countries in 2024
-

 Wealth2 weeks ago
Charted: Which City Has the Most Billionaires in 2024?
-

 Technology2 weeks ago
All of the Grants Given by the U.S. CHIPS Act
-

 Green1 week ago
The Carbon Footprint of Major Travel Methods
-

 United States1 week ago
Visualizing the Most Common Pets in the U.S.
-

 Culture1 week ago
The World’s Top Media Franchises by All-Time Revenue