Technology
Visualizing the Diversity of the Tech Industry
Visualizing the Diversity of the Tech Industry
With the recent leak of the “Google Manifesto” and the maelstrom of media backlash that followed, it seems that concerns around diversity in the technology industry have finally reached a boiling point.
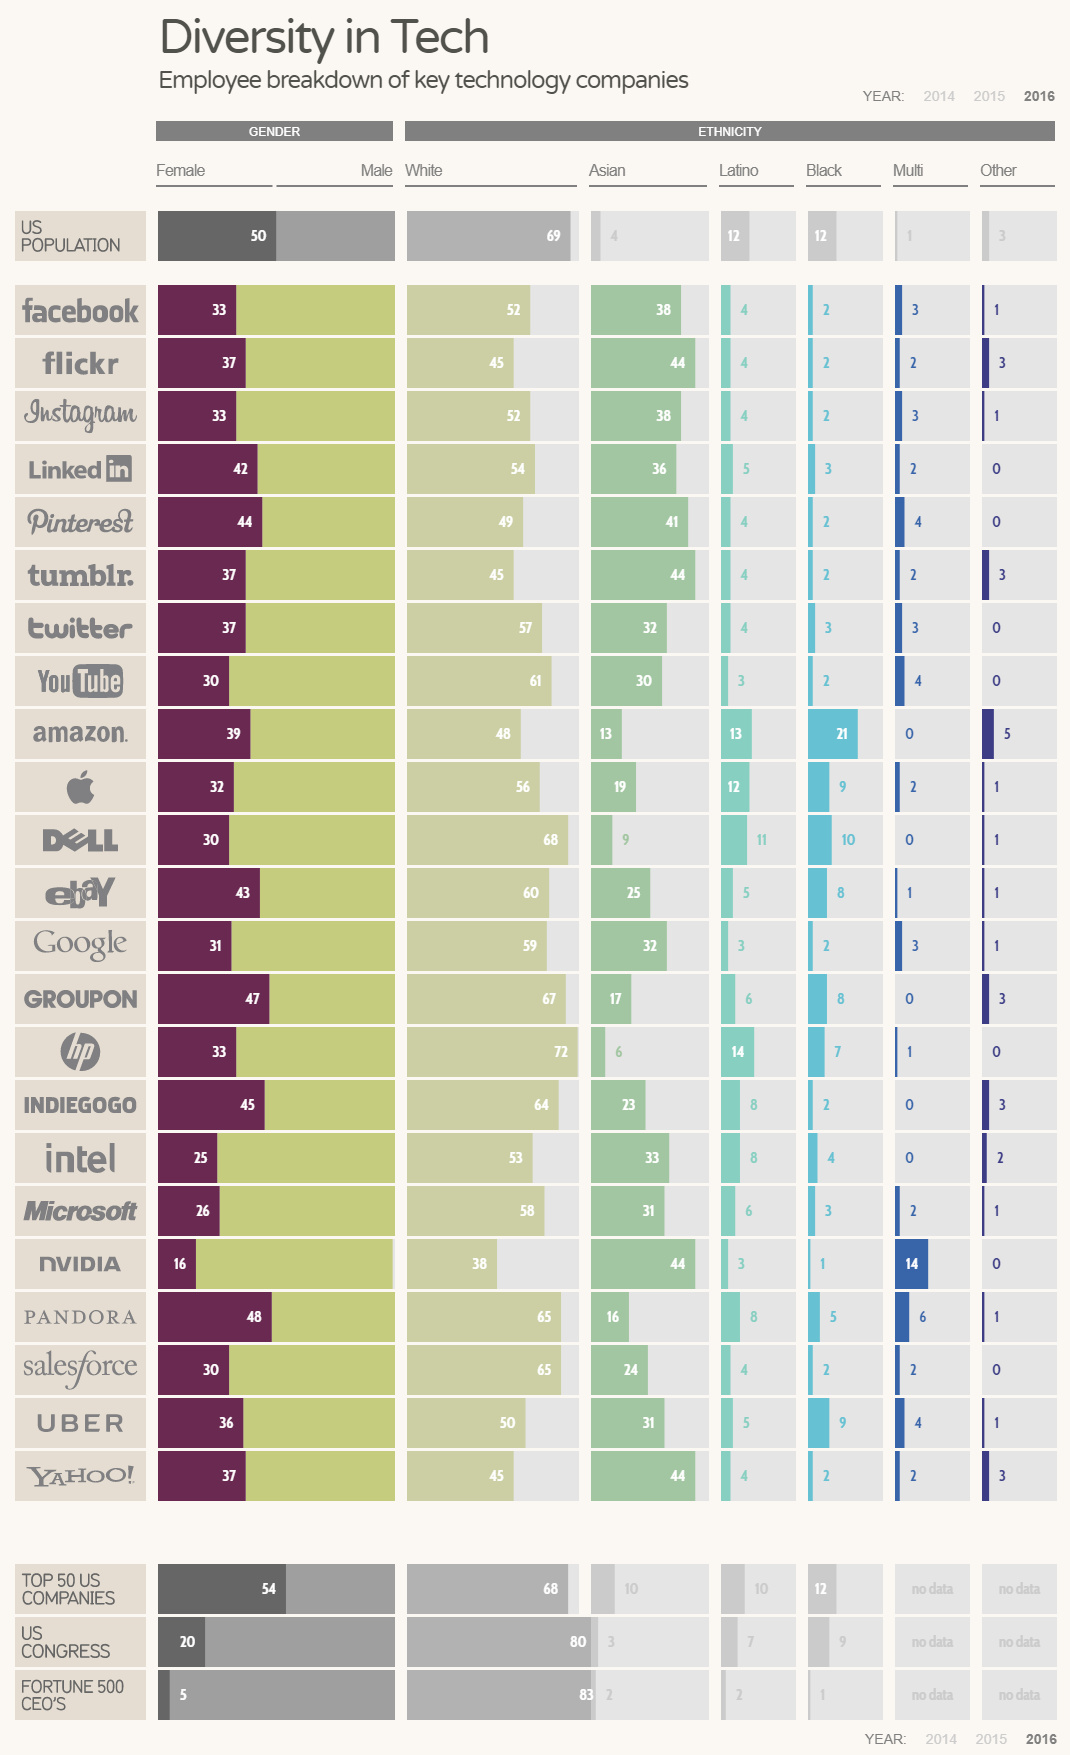
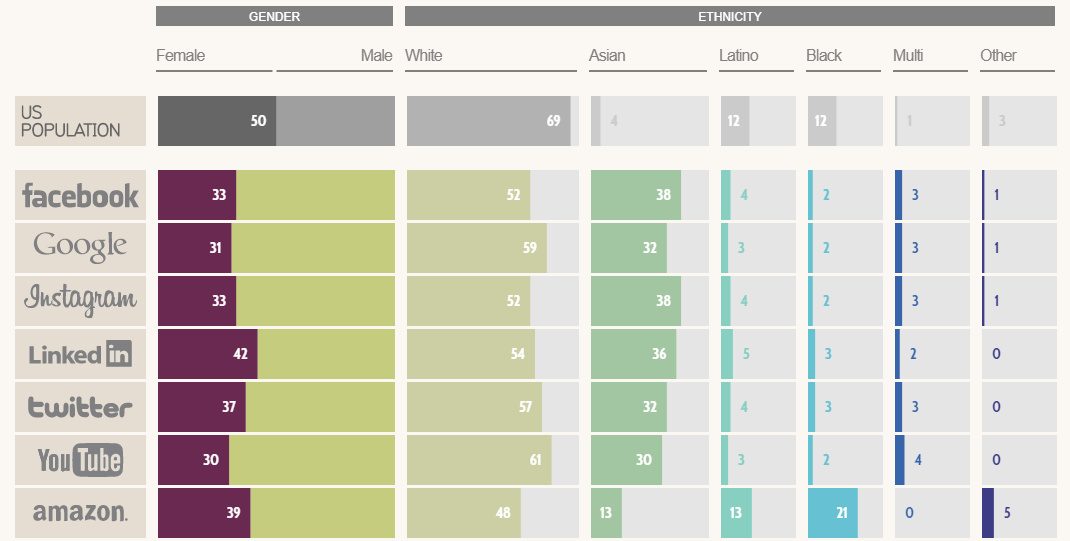
Today’s infographic from Information is Beautiful breaks down the demographics of 23 major tech companies, based on statistics from 2016. It also provides comparisons to the composition of the U.S. population in general, the top 50 U.S. companies, Congress, and Fortune 500 CEOs.
Which Companies Employ the Most Women?
With just a focus on the major companies on this list, here is a breakdown that shows which companies employ the most women:
| Rank | Tech Company | % of Females |
|---|---|---|
| #1 | Pandora | 48% |
| #2 | Groupon | 47% |
| #3 | Indiegogo | 45% |
| #4 | 44% | |
| #5 | eBay | 43% |
| U.S. Population Avg. | 50% |
The above list already illustrates why diversity is such a concern for many observers of the industry: even the companies with the most women on their rosters have proportions lower than U.S. population average of 50%.
In contrast, here are the companies on the list that employ the fewest women, as a proportion of their workforce:
| Rank | Tech Company | % of Females |
|---|---|---|
| #18 (t) | Salesforce | 30% |
| #18 (t) | Youtube | 30% |
| #18 (t) | Dell | 30% |
| #21 | Microsoft | 26% |
| #22 | Intel | 25% |
| #23 | Nvidia | 16% |
Google, which is at the center of debate right now, did not make the list of the companies with the fewest women – but it’s not far off with a workforce comprised of 31% women.
What’s Changed in the Last 12 Months?
According to Information is Beautiful, here is what has changed in the last 12 months as of their last update (April 2017):
- Facebook, Apple, eBay, and Microsoft all had their ratio of women increase by 1%.
- LinkedIn had their ratio of women increase by 3%.
- Google’s gender ratio stayed the same.
- Microsoft increased the ratio of non-white employees by 3%, and Facebook by 2%.
- Google, Apple, and eBay increased ratio of non-white employees by 1%.
- LinkedIn lost 3% of its non-white employees.
- Asian staff accounted for the majority of increases in ethnic diversity, while the ratio of Hispanic employees remained static.
To get an even better sense of the data, we recommend visiting the interactive version of Information is Beautiful’s graphic, which shows numbers for 2014 and 2015 as well.


Technology
Visualizing AI Patents by Country
See which countries have been granted the most AI patents each year, from 2012 to 2022.


Visualizing AI Patents by Country
This was originally posted on our Voronoi app. Download the app for free on iOS or Android and discover incredible data-driven charts from a variety of trusted sources.
This infographic shows the number of AI-related patents granted each year from 2010 to 2022 (latest data available). These figures come from the Center for Security and Emerging Technology (CSET), accessed via Stanford University’s 2024 AI Index Report.
From this data, we can see that China first overtook the U.S. in 2013. Since then, the country has seen enormous growth in the number of AI patents granted each year.
| Year | China | EU and UK | U.S. | RoW | Global Total |
|---|---|---|---|---|---|
| 2010 | 307 | 137 | 984 | 571 | 1,999 |
| 2011 | 516 | 129 | 980 | 581 | 2,206 |
| 2012 | 926 | 112 | 950 | 660 | 2,648 |
| 2013 | 1,035 | 91 | 970 | 627 | 2,723 |
| 2014 | 1,278 | 97 | 1,078 | 667 | 3,120 |
| 2015 | 1,721 | 110 | 1,135 | 539 | 3,505 |
| 2016 | 1,621 | 128 | 1,298 | 714 | 3,761 |
| 2017 | 2,428 | 144 | 1,489 | 1,075 | 5,136 |
| 2018 | 4,741 | 155 | 1,674 | 1,574 | 8,144 |
| 2019 | 9,530 | 322 | 3,211 | 2,720 | 15,783 |
| 2020 | 13,071 | 406 | 5,441 | 4,455 | 23,373 |
| 2021 | 21,907 | 623 | 8,219 | 7,519 | 38,268 |
| 2022 | 35,315 | 1,173 | 12,077 | 13,699 | 62,264 |
In 2022, China was granted more patents than every other country combined.
While this suggests that the country is very active in researching the field of artificial intelligence, it doesn’t necessarily mean that China is the farthest in terms of capability.
Key Facts About AI Patents
According to CSET, AI patents relate to mathematical relationships and algorithms, which are considered abstract ideas under patent law. They can also have different meaning, depending on where they are filed.
In the U.S., AI patenting is concentrated amongst large companies including IBM, Microsoft, and Google. On the other hand, AI patenting in China is more distributed across government organizations, universities, and tech firms (e.g. Tencent).
In terms of focus area, China’s patents are typically related to computer vision, a field of AI that enables computers and systems to interpret visual data and inputs. Meanwhile America’s efforts are more evenly distributed across research fields.
Learn More About AI From Visual Capitalist
If you want to see more data visualizations on artificial intelligence, check out this graphic that shows which job departments will be impacted by AI the most.

-

 Mining1 week ago
Gold vs. S&P 500: Which Has Grown More Over Five Years?
-

 Markets2 weeks ago
Ranked: The Most Valuable Housing Markets in America
-

 Money2 weeks ago
Which States Have the Highest Minimum Wage in America?
-

 AI2 weeks ago
Ranked: Semiconductor Companies by Industry Revenue Share
-

 Markets2 weeks ago
Ranked: The World’s Top Flight Routes, by Revenue
-

 Countries2 weeks ago
Population Projections: The World’s 6 Largest Countries in 2075
-

 Markets2 weeks ago
The Top 10 States by Real GDP Growth in 2023
-

 Demographics2 weeks ago
The Smallest Gender Wage Gaps in OECD Countries