Markets
The Chinese Growth Engine is Sputtering
By the turn of the millennium, China was the sixth most productive nation in the world with a GDP comparable with France or Italy at US$1.2 trillion.
Economic growth didn’t stop there, and GDP increased ten-fold over the last fifteen years to surpass US$10 trillion. In “real” terms using PPP, China is now actually the largest economy in the world.
The rest of the world has benefited extensively from China’s coming out party. Cheap products flooded the shelves of the developed world, and China bought the world’s raw materials when no one else wanted them. Unfortunately, every good time must come to an end.
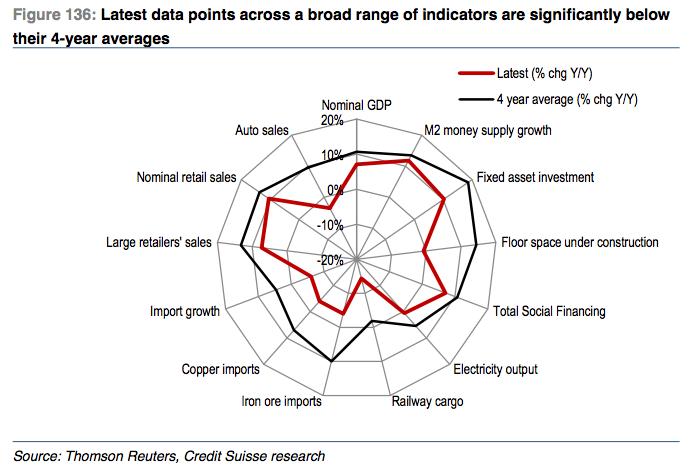
It hasn’t exactly been a secret that China’s economy has been slowing. The above radar graph from a research note by Credit Suisse shows that the economic news out of China has been tough to swallow as of late. Today, China rattled global markets even further by announcing a devaluation of the yuan by 1.9% to combat poor exports, which fell by 8.3% in July. This is the country’s largest currency devaluation since 1994.
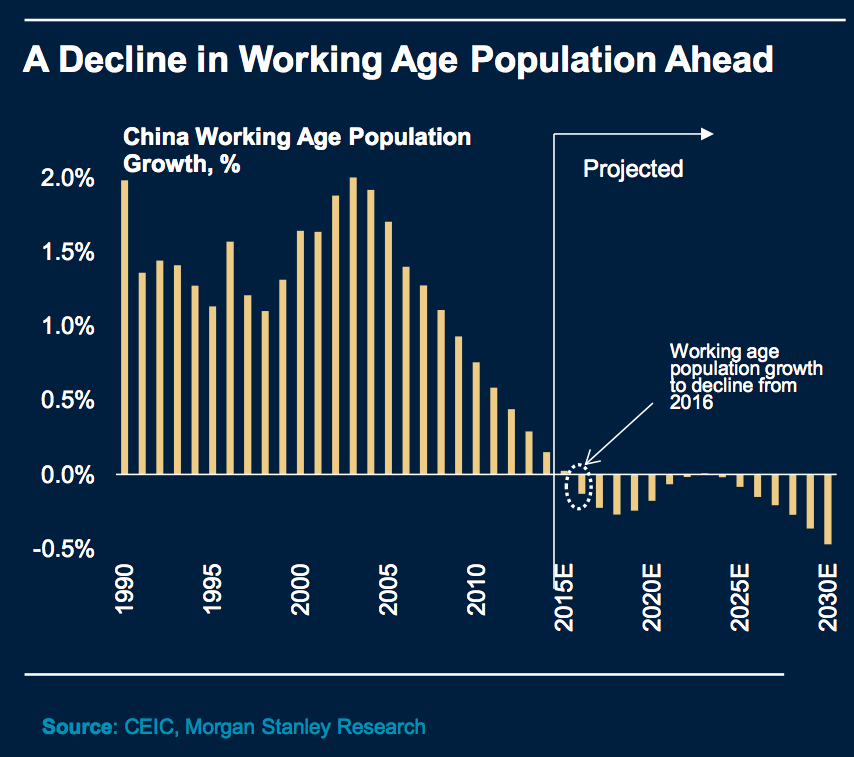
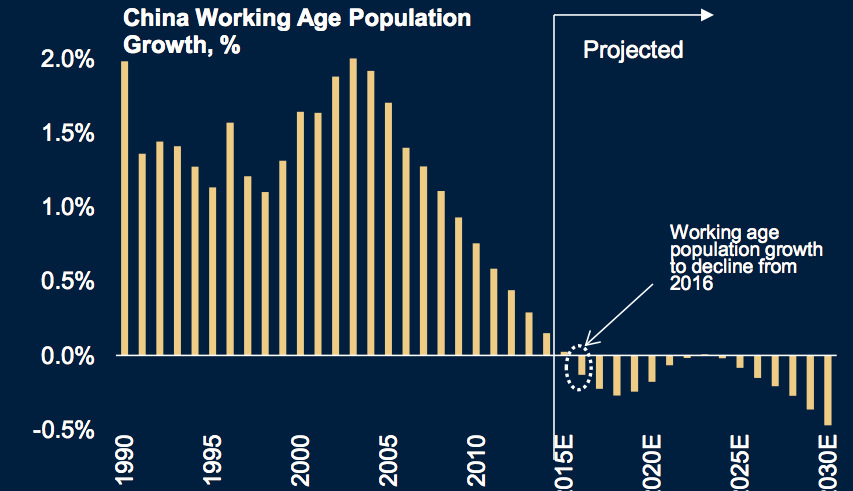
The real problem for China is far more entrenched: the country’s demographics have been a ticking timebomb for decades. The one-child policy meant that at some point in the future, the country would have an aging population that could not be replaced in the workforce.
Unfortunately these demographic headwinds are now in full gear now and they are hitting China at the worst possible time. The size of China’s working population is set to begin declining.
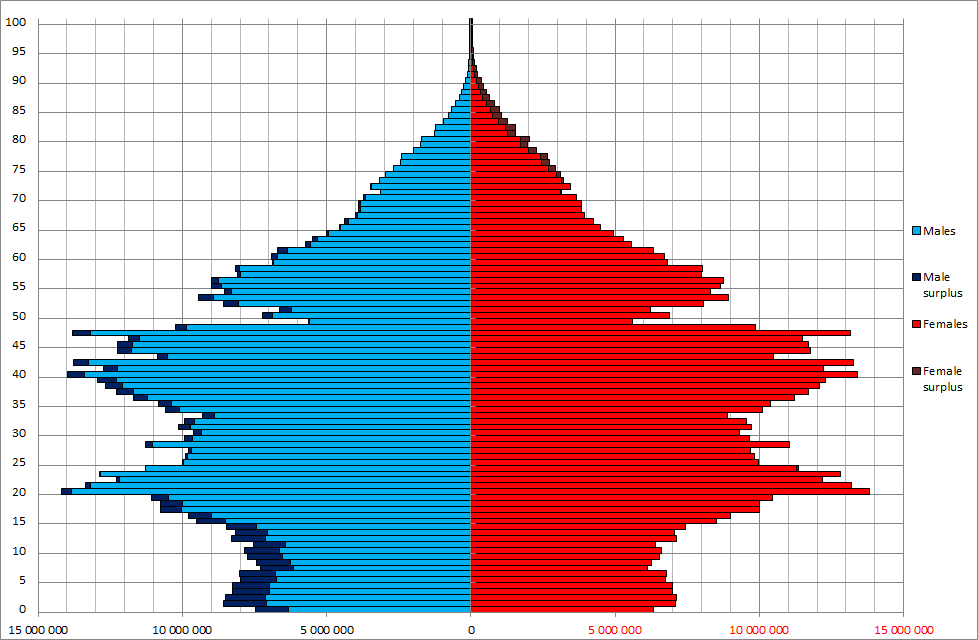
Here’s a more in-depth look at China’s population pyramid from the 2010 census. Note that those who are 15 years old are now 20, and you will see that there are not many young people to enter the workforce, as well as the fact that there is an overabundance of males in the country (a separate demographic issue).
As the easy fuel for growth runs out, companies have sought to increase productivity by other means. Debt has soared for non-financial corporations in the country.
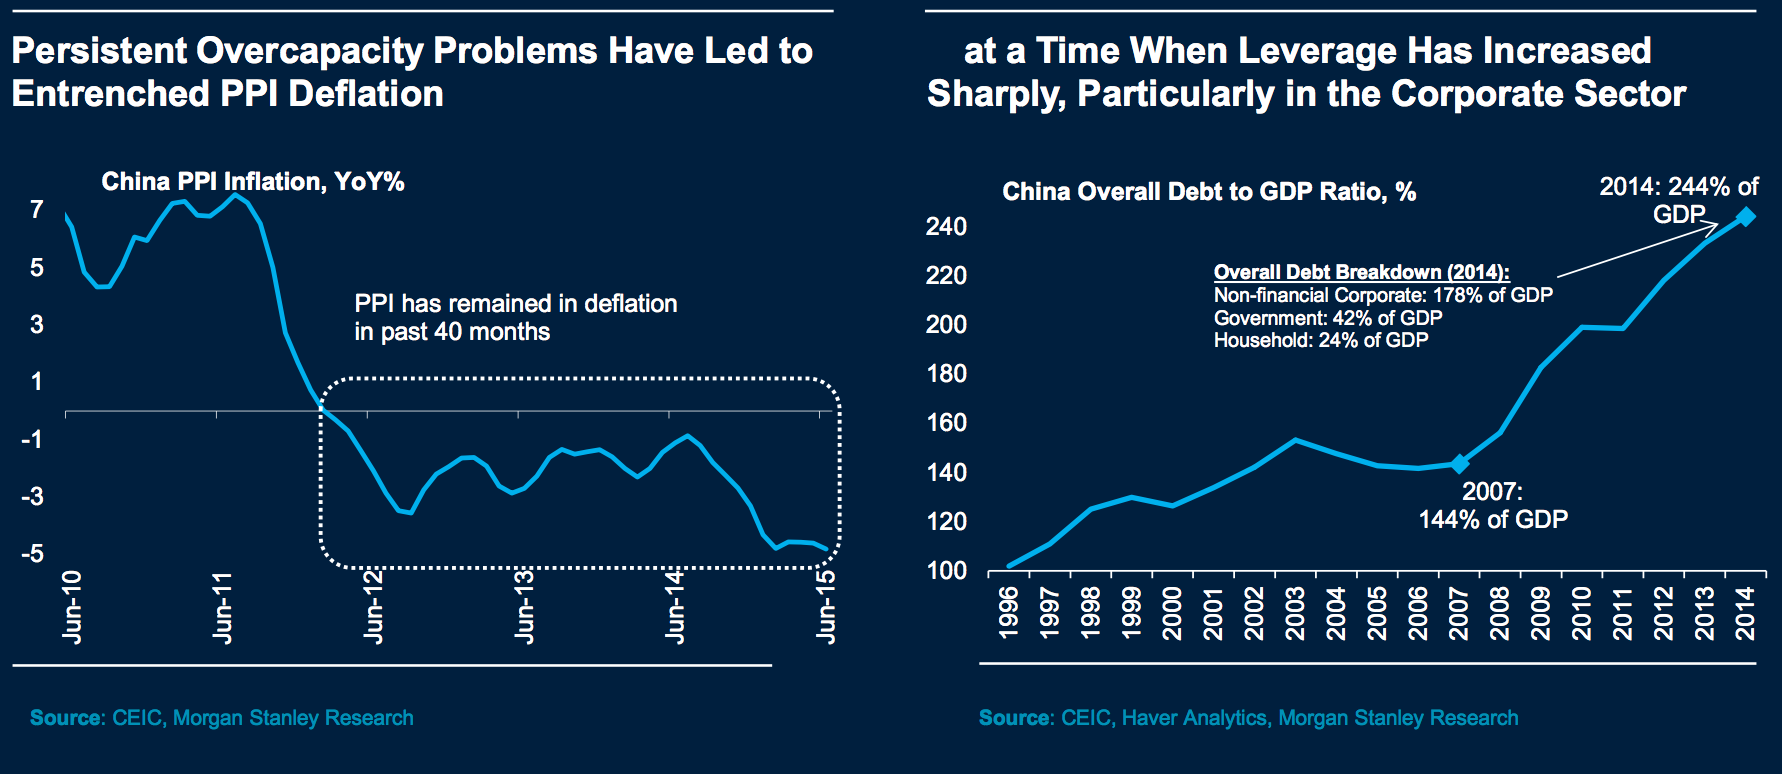
In the long run, growth is a function of changes in labour, capital and productivity. The Chinese growth engine is now sputtering: there is a shortage of young people in the workforce, exports are decreasing, investment has topped out, and its soaring debt will surely impede future growth.
We must now ask (and answer) the question: When Will India be the Next China?


Markets
Visualizing Global Inflation Forecasts (2024-2026)
Here are IMF forecasts for global inflation rates up to 2026, highlighting a slow descent of price pressures amid resilient global growth.


Visualizing Global Inflation Forecasts (2024-2026)
Global inflation rates are gradually descending, but progress has been slow.
Today, the big question is if inflation will decline far enough to trigger easing monetary policy. So far, the Federal Reserve has held rates for nine months amid stronger than expected core inflation, which excludes volatile energy and food prices.
Yet looking further ahead, inflation forecasts from the International Monetary Fund (IMF) suggest that inflation will decline as price pressures ease, but the path of disinflation is not without its unknown risks.
This graphic shows global inflation forecasts, based on data from the April 2024 IMF World Economic Outlook.
Get the Key Insights of the IMF’s World Economic Outlook
Want a visual breakdown of the insights from the IMF’s 2024 World Economic Outlook report?
This visual is part of a special dispatch of the key takeaways exclusively for VC+ members.
Get the full dispatch of charts by signing up to VC+.
The IMF’s Inflation Outlook
Below, we show the IMF’s latest projections for global inflation rates through to 2026:
| Year | Global Inflation Rate (%) | Advanced Economies Inflation Rate (%) | Emerging Market and Developing Economies Inflation Rate (%) |
|---|---|---|---|
| 2019 | 3.5 | 1.4 | 5.1 |
| 2020 | 3.2 | 0.7 | 5.2 |
| 2021 | 4.7 | 3.1 | 5.9 |
| 2022 | 8.7 | 7.3 | 9.8 |
| 2023 | 6.8 | 4.6 | 8.3 |
| 2024 | 5.9 | 2.6 | 8.3 |
| 2025 | 4.5 | 2.0 | 6.2 |
| 2026 | 3.7 | 2.0 | 4.9 |
After hitting a peak of 8.7% in 2022, global inflation is projected to fall to 5.9% in 2024, reflecting promising inflation trends amid resilient global growth.
While inflation has largely declined due to falling energy and goods prices, persistently high services inflation poses challenges to mitigating price pressures. In addition, the IMF highlights the potential risk of an escalating conflict in the Middle East, which could lead to energy price shocks and higher shipping costs.
These developments could negatively affect inflation scenarios and prompt central banks to adopt tighter monetary policies. Overall, by 2026, global inflation is anticipated to decline to 3.7%—still notably above the 2% target set by several major economies.
Adding to this, we can see divergences in the path of inflation between advanced and emerging economies. While affluent nations are forecast to see inflation edge closer to the 2% target by 2026, emerging economies are projected to have inflation rates reach 4.9%—falling closer to their pre-pandemic averages.
Get the Full Analysis of the IMF’s Outlook on VC+
This visual is part of an exclusive special dispatch for VC+ members which breaks down the key takeaways from the IMF’s 2024 World Economic Outlook.
For the full set of charts and analysis, sign up for VC+.

-

 Markets7 days ago
The Best U.S. Companies to Work for According to LinkedIn
-

 Economy2 weeks ago
VC+: Get Our Key Takeaways From the IMF’s World Economic Outlook
-

 Demographics2 weeks ago
The Countries That Have Become Sadder Since 2010
-

 Money2 weeks ago
Charted: Who Has Savings in This Economy?
-

 Technology2 weeks ago
Visualizing AI Patents by Country
-

 Markets2 weeks ago
Economic Growth Forecasts for G7 and BRICS Countries in 2024
-

 Wealth2 weeks ago
Charted: Which City Has the Most Billionaires in 2024?
-

 Technology1 week ago
All of the Grants Given by the U.S. CHIPS Act