Technology
The Slowdown in Venture Capital Deals is a Cause for Concern
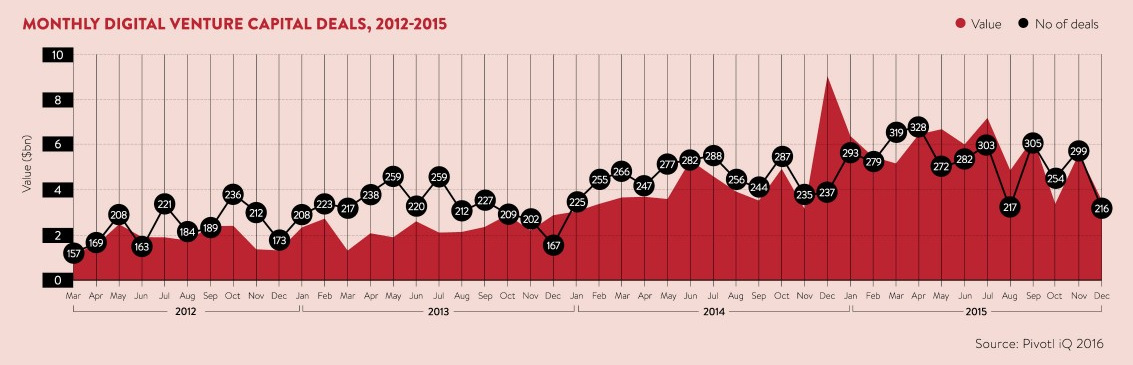
Last year, the market for venture capital soared to new heights. A record amount of money was raised, with global funding for VC-backed companies reaching $128.5 billion, a 44% jump from 2014.
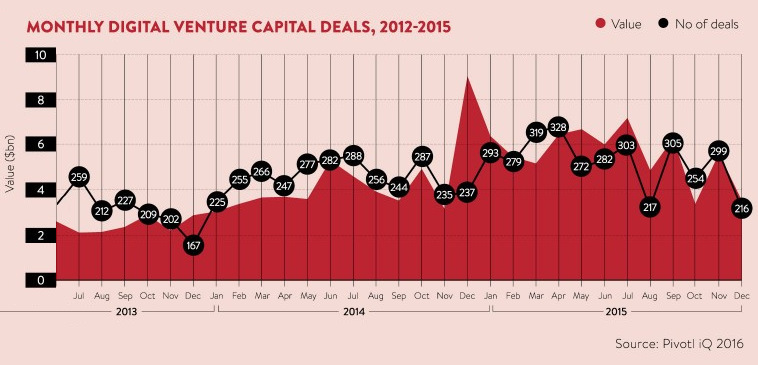
However, this impressive annual data doesn’t show the whole picture. The fact of the matter is that the flow of venture capital deals peaked mid-year, and then began to disintegrate in the autumn.
Here’s another look, this time with quarterly data from CB Insights:
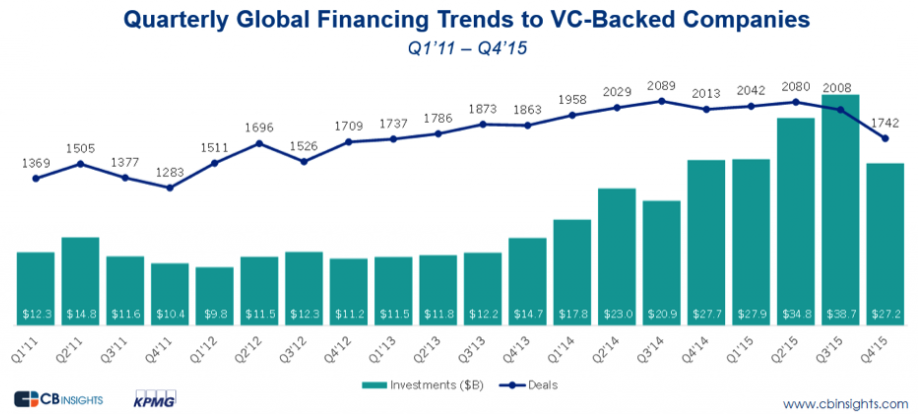
The data for Q4 is a steep drop off in terms of deal-flow, and this number hasn’t been this low since Q1 of 2013. The better news is that a total of $27.2 billion was raised, which is more or less on par with previous quarters.
What’s Happening?
Venture capital stalwarts have noted that this lack of deals could be a blip on the radar.
“I’m not aware of any VC who pays attention to any quarter to quarter data at all,” Marc Andreessen, a prominent name in venture capital, noted in a Forbes piece.
That said, a sudden slowdown of this magnitude does raise questions. This is especially true given some of the market developments of 2015.
Firstly, this slowdown in venture capital deals has corresponded with the general anxiety and volatility occurring in public markets. Further, it’s also occurring on the heels of several less-than-stellar IPO performances and repeated calls of a tech valuation bubble. Lastly, while 2015 set records in terms of dollars spent in terms of funding, the amount of new capital raised by venture capital funds dipped significantly from 2014 levels.
This evidence would suggest that venture capital firms, as well as those that fund them, are becoming more discriminatory in how they spend their money.
Venture Capital in 2015: At a Glance
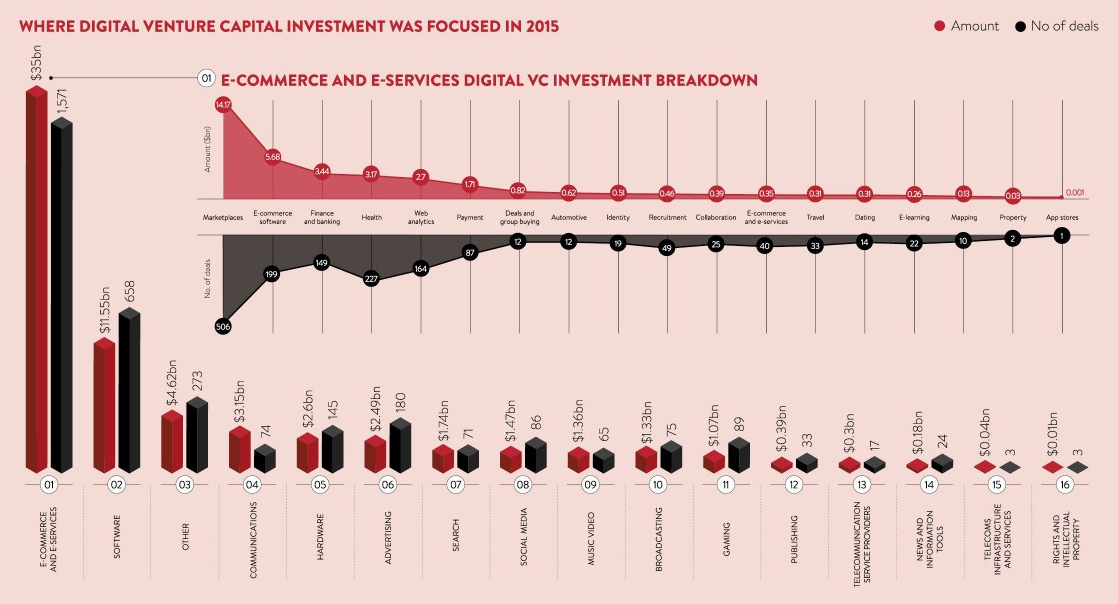
Where did venture capital money go to in 2015?
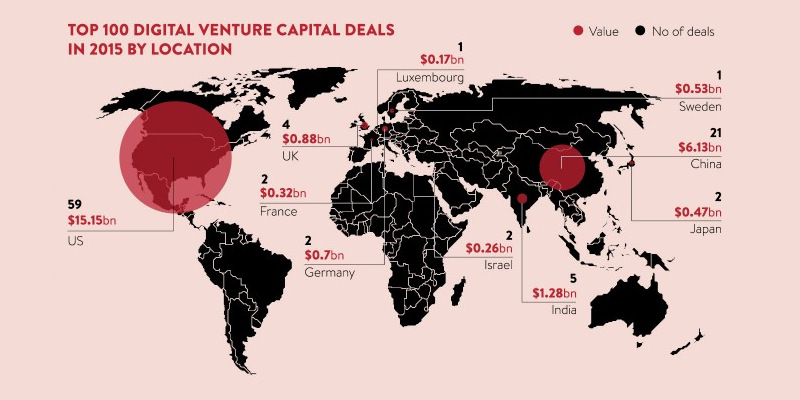
Here are some further charts from Raconteur that show the distribution behind the 100 biggest venture capital deals:
Top 100 Deals by Region
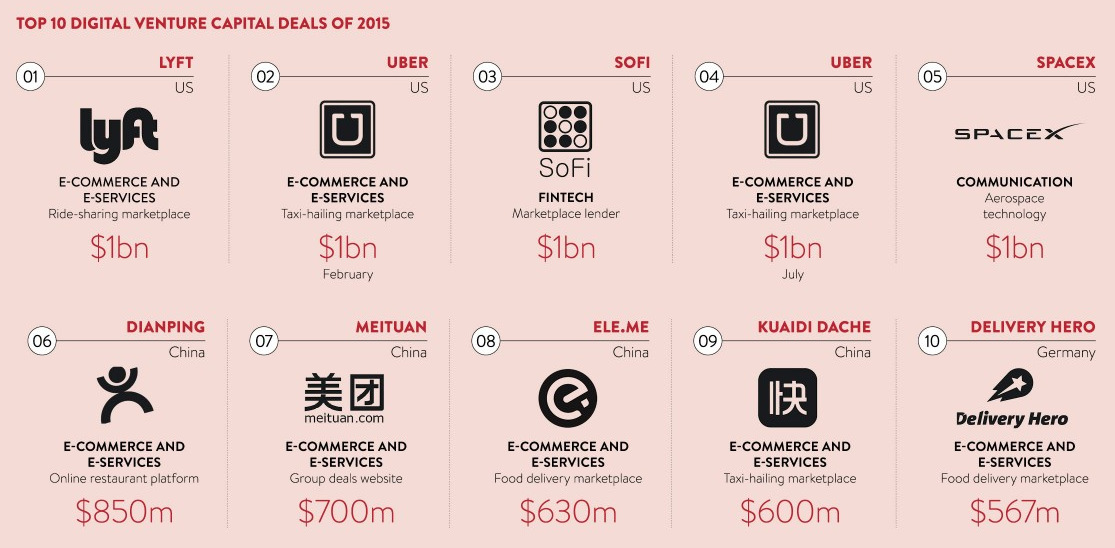
10 Largest Raises in Digital
Digital Deals by Sector
Click image to expand


Digital Transformation
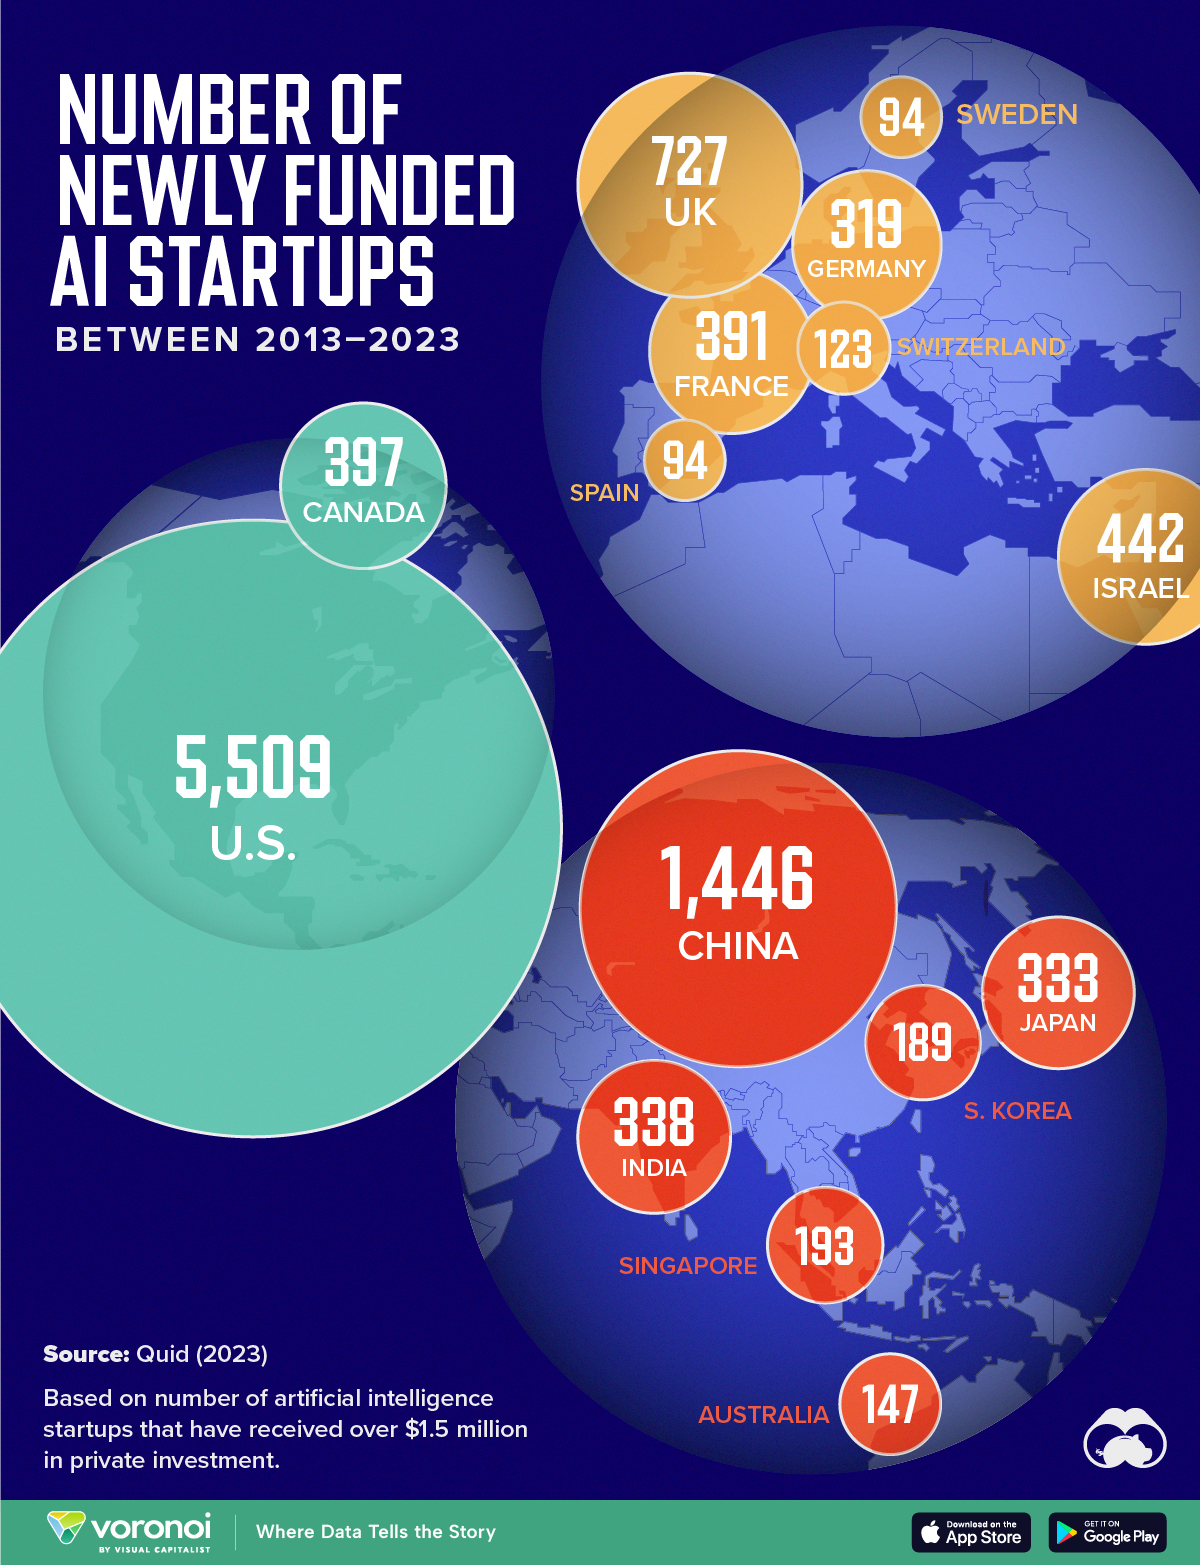
Mapped: The Number of AI Startups By Country
Over the past decade, thousands of AI startups have been funded worldwide. See which countries are leading the charge in this map graphic.
Mapped: The Number of AI Startups By Country
This was originally posted on our Voronoi app. Download the app for free on iOS or Android and discover incredible data-driven charts from a variety of trusted sources.
Amidst the recent expansion of artificial intelligence (AI), we’ve visualized data from Quid (accessed via Stanford’s 2024 AI Index Report) to highlight the top 15 countries which have seen the most AI startup activity over the past decade.
The figures in this graphic represent the number of newly funded AI startups within that country, in the time period of 2013 to 2023. Only companies that received over $1.5 million in private investment were considered.
Data and Highlights
The following table lists all of the numbers featured in the above graphic.
| Rank | Geographic area | Number of newly funded AI startups (2013-2023) |
|---|---|---|
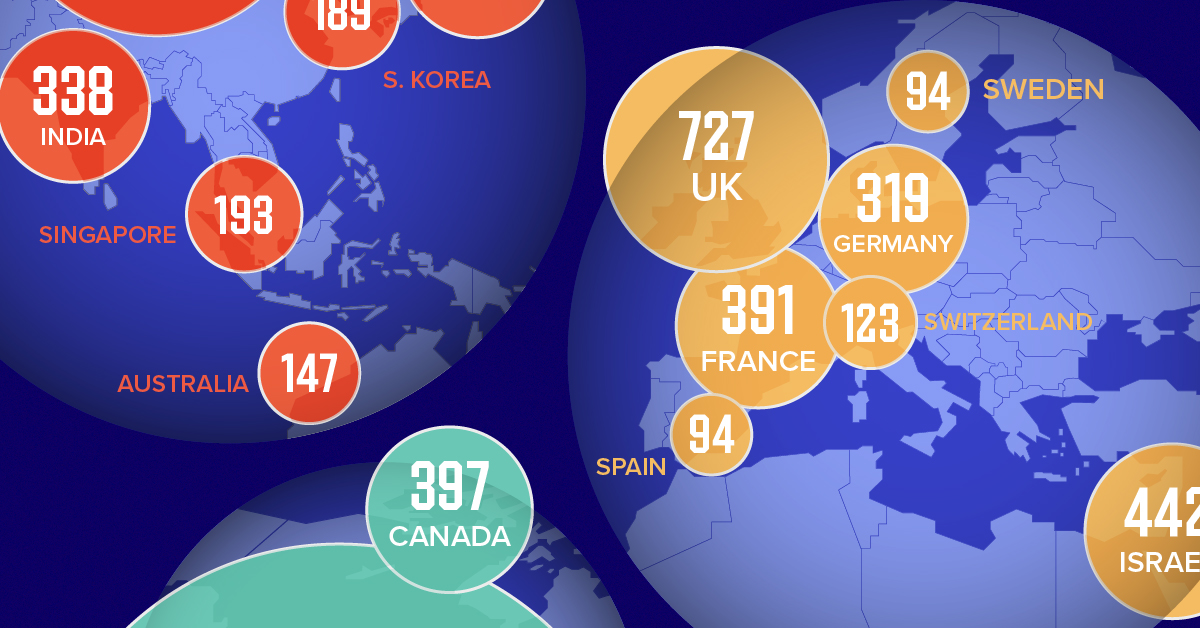
| 1 | 🇺🇸 United States | 5,509 |
| 2 | 🇨🇳 China | 1,446 |
| 3 | 🇬🇧 United Kingdom | 727 |
| 4 | 🇮🇱 Israel | 442 |
| 5 | 🇨🇦 Canada | 397 |
| 6 | 🇫🇷 France | 391 |
| 7 | 🇮🇳 India | 338 |
| 8 | 🇯🇵 Japan | 333 |
| 9 | 🇩🇪 Germany | 319 |
| 10 | 🇸🇬 Singapore | 193 |
| 11 | 🇰🇷 South Korea | 189 |
| 12 | 🇦🇺 Australia | 147 |
| 13 | 🇨🇭 Switzerland | 123 |
| 14 | 🇸🇪 Sweden | 94 |
| 15 | 🇪🇸 Spain | 94 |
From this data, we can see that the U.S., China, and UK have established themselves as major hotbeds for AI innovation.
In terms of funding, the U.S. is massively ahead, with private AI investment totaling $335 billion between 2013 to 2023. AI startups in China raised $104 billion over the same timeframe, while those in the UK raised $22 billion.
Further analysis reveals that the U.S. is widening this gap even more. In 2023, for example, private investment in the U.S. grew by 22% from 2022 levels. Meanwhile, investment fell in China (-44%) and the UK (-14.1%) over the same time span.
Where is All This Money Flowing To?
Quid also breaks down total private AI investment by focus area, providing insight into which sectors are receiving the most funding.
| Focus Area | Global Investment in 2023 (USD billions) |
|---|---|
| 🤖 AI infrastructure, research, and governance | $18.3 |
| 🗣️ Natural language processing | $8.1 |
| 📊 Data management | $5.5 |
| ⚕️ Healthcare | $4.2 |
| 🚗 Autonomous vehicles | $2.7 |
| 💰 Fintech | $2.1 |
| ⚛️ Quantum computing | $2.0 |
| 🔌 Semiconductor | $1.7 |
| ⚡ Energy, oil, and gas | $1.5 |
| 🎨 Creative content | $1.3 |
| 📚 Education | $1.2 |
| 📈 Marketing | $1.1 |
| 🛸 Drones | $1.0 |
| 🔒 Cybersecurity | $0.9 |
| 🏭 Manufacturing | $0.9 |
| 🛒 Retail | $0.7 |
| 🕶️ AR/VR | $0.7 |
| 🛡️ Insurtech | $0.6 |
| 🎬 Entertainment | $0.5 |
| 💼 VC | $0.5 |
| 🌾 Agritech | $0.5 |
| ⚖️ Legal tech | $0.4 |
| 👤 Facial recognition | $0.3 |
| 🌐 Geospatial | $0.2 |
| 💪 Fitness and wellness | $0.2 |
Attracting the most money is AI infrastructure, research, and governance, which refers to startups that are building AI applications (like OpenAI’s ChatGPT).
The second biggest focus area is natural language processing (NLP), which is a type of AI that enables computers to understand and interpret human language. This technology has numerous use cases for businesses, particularly in financial services, where NLP can power customer support chatbots and automated wealth advisors.
With $8 billion invested into NLP-focused startups during 2023, investors appear keenly aware of this technology’s transformative potential.
Learn More About AI From Visual Capitalist
If you enjoyed this graphic, be sure to check out Visualizing AI Patents by Country.

-

 Mining6 days ago
Visualizing Global Gold Production in 2023
-

 AI2 weeks ago
Visualizing AI Patents by Country
-

 Markets2 weeks ago
Economic Growth Forecasts for G7 and BRICS Countries in 2024
-

 Wealth2 weeks ago
Charted: Which City Has the Most Billionaires in 2024?
-

 Technology2 weeks ago
All of the Grants Given by the U.S. CHIPS Act
-

 Green1 week ago
The Carbon Footprint of Major Travel Methods
-

 United States1 week ago
Visualizing the Most Common Pets in the U.S.
-

 Culture1 week ago
The World’s Top Media Franchises by All-Time Revenue