Technology
Every 10 Seconds, the World’s Tech Giants Make This Much Money…
There is no question that the most profound factor affecting modern life is the ability to replicate and store data at almost no cost. This revolution in information has provided us with a wealth of benefits and possibilities for an incredibly low marginal price.
At zero cost, we can connect to a global store of all human knowledge. New apps with impressive features can cost less than a dollar, and our monthly Netflix subscriptions hardly register on our credit card statements. Meanwhile, we share our thoughts about the world with our friends and family at no cost through social networks, email, or other means of communications. This hasn’t been possible throughout human existence, and it is only feasible now because of the incredible scale of the internet.
While we all make the connection that these individual activities help to bring in revenue to the world’s tech giants, the ultimate size and scale of the numbers in aggregate are almost incomprehensible to the human brain.
How many Google searches do you make each day? What about your neighborhood, city, or country? How about the world?
Today’s two visualizations look at the sheer amounts of data processed every 10 seconds by the world’s tech giants, as well as the amount of impressive profit yielded.
How much data is processed every 10 seconds?
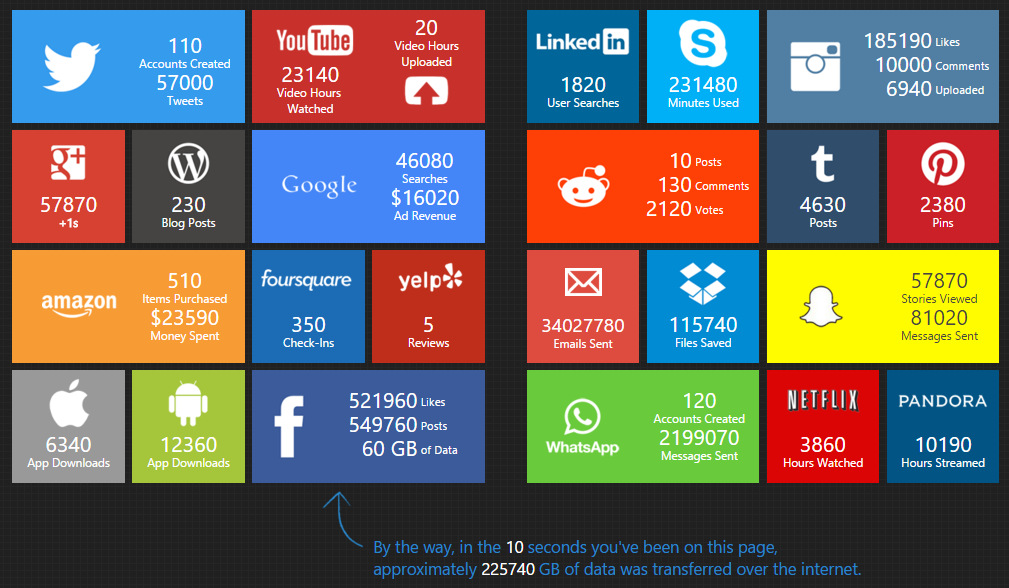
In just 10 seconds, close to 225,000 GB of data is transferred, with over 500,000 posts on Facebook, 57,000 tweets, 46,000 searches on Google, and 2 million messages sent on WhatsApp.
While each click or view may only translate to pennies for the world’s tech giants, in aggregate it amounts to so much more:
How much profit is made every 10 seconds?
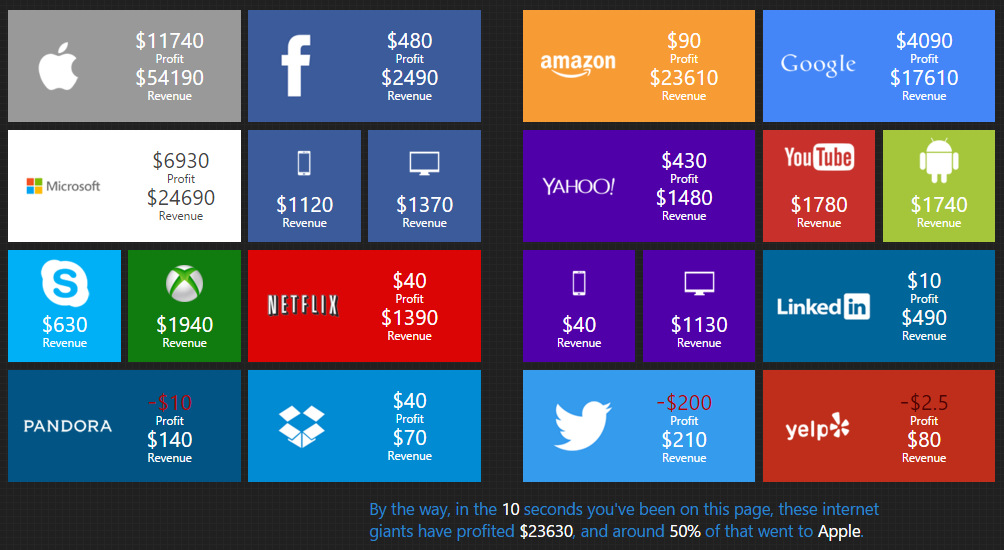
The numbers are astounding, and hopefully help to create perspective on the scale of technology and business.
Want to see this spectacle in real-time? Go to this website.


Technology
Visualizing AI Patents by Country
See which countries have been granted the most AI patents each year, from 2012 to 2022.


Visualizing AI Patents by Country
This was originally posted on our Voronoi app. Download the app for free on iOS or Android and discover incredible data-driven charts from a variety of trusted sources.
This infographic shows the number of AI-related patents granted each year from 2010 to 2022 (latest data available). These figures come from the Center for Security and Emerging Technology (CSET), accessed via Stanford University’s 2024 AI Index Report.
From this data, we can see that China first overtook the U.S. in 2013. Since then, the country has seen enormous growth in the number of AI patents granted each year.
| Year | China | EU and UK | U.S. | RoW | Global Total |
|---|---|---|---|---|---|
| 2010 | 307 | 137 | 984 | 571 | 1,999 |
| 2011 | 516 | 129 | 980 | 581 | 2,206 |
| 2012 | 926 | 112 | 950 | 660 | 2,648 |
| 2013 | 1,035 | 91 | 970 | 627 | 2,723 |
| 2014 | 1,278 | 97 | 1,078 | 667 | 3,120 |
| 2015 | 1,721 | 110 | 1,135 | 539 | 3,505 |
| 2016 | 1,621 | 128 | 1,298 | 714 | 3,761 |
| 2017 | 2,428 | 144 | 1,489 | 1,075 | 5,136 |
| 2018 | 4,741 | 155 | 1,674 | 1,574 | 8,144 |
| 2019 | 9,530 | 322 | 3,211 | 2,720 | 15,783 |
| 2020 | 13,071 | 406 | 5,441 | 4,455 | 23,373 |
| 2021 | 21,907 | 623 | 8,219 | 7,519 | 38,268 |
| 2022 | 35,315 | 1,173 | 12,077 | 13,699 | 62,264 |
In 2022, China was granted more patents than every other country combined.
While this suggests that the country is very active in researching the field of artificial intelligence, it doesn’t necessarily mean that China is the farthest in terms of capability.
Key Facts About AI Patents
According to CSET, AI patents relate to mathematical relationships and algorithms, which are considered abstract ideas under patent law. They can also have different meaning, depending on where they are filed.
In the U.S., AI patenting is concentrated amongst large companies including IBM, Microsoft, and Google. On the other hand, AI patenting in China is more distributed across government organizations, universities, and tech firms (e.g. Tencent).
In terms of focus area, China’s patents are typically related to computer vision, a field of AI that enables computers and systems to interpret visual data and inputs. Meanwhile America’s efforts are more evenly distributed across research fields.
Learn More About AI From Visual Capitalist
If you want to see more data visualizations on artificial intelligence, check out this graphic that shows which job departments will be impacted by AI the most.

-

 Markets1 week ago
U.S. Debt Interest Payments Reach $1 Trillion
-

 Markets2 weeks ago
Ranked: The Most Valuable Housing Markets in America
-

 Money2 weeks ago
Which States Have the Highest Minimum Wage in America?
-

 AI2 weeks ago
Ranked: Semiconductor Companies by Industry Revenue Share
-

 Markets2 weeks ago
Ranked: The World’s Top Flight Routes, by Revenue
-

 Countries2 weeks ago
Population Projections: The World’s 6 Largest Countries in 2075
-

 Markets2 weeks ago
The Top 10 States by Real GDP Growth in 2023
-

 Money2 weeks ago
The Smallest Gender Wage Gaps in OECD Countries