Markets
Hedge Fund Rich List: Who Stayed Afloat in Worst Year Since 2008?
Hedge Fund Rich List: Who Stayed Afloat in Worst Year Since 2008?
Every year, Institutional Investor’s Alpha documents the performance of the world’s most elite investors: hedge fund managers. The Hedge Fund Rich List, in its 14th year of publication, is a “who’s who” of the industry and highlights the performances of the most successful investment managers in the world.
Our infographic today is based on this report, and it breaks down the last year for this elite group.
The Worst Year Since the Financial Crisis
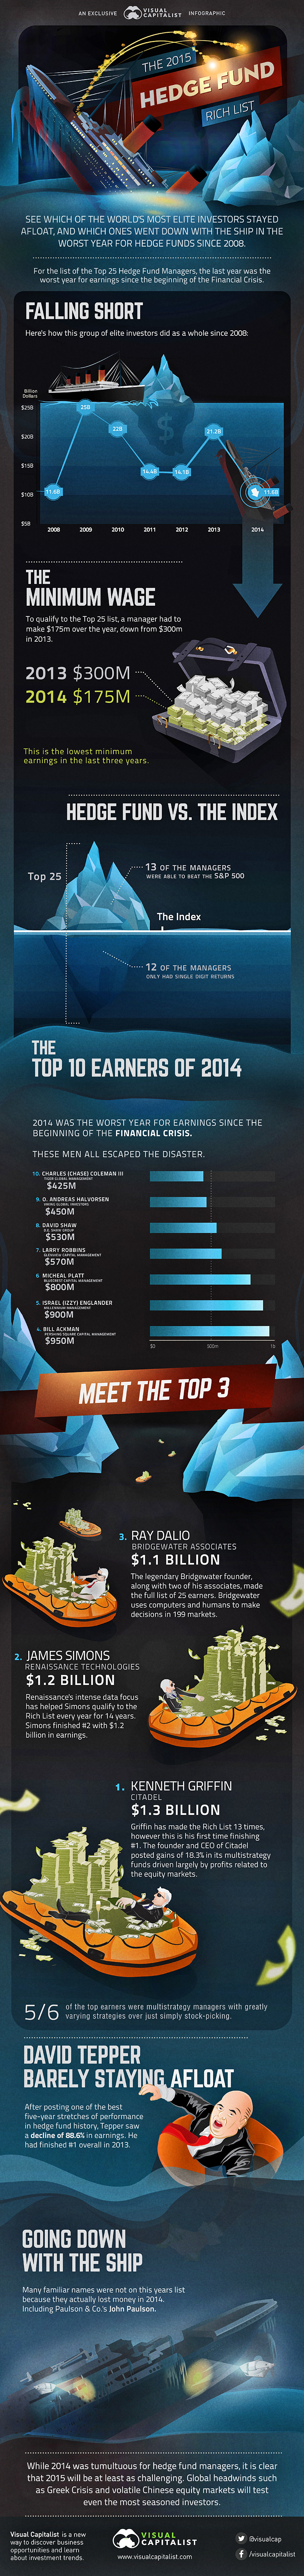
The performance of this collective of top-notch investors was the worst as a whole since the Financial Crisis in 2008. In the previous five years, their total earnings averaged $19.3 billion. Last year, the group brought in a paltry $11.6 billion. This brought average earnings per person down to $467 million over the year from $846 million in 2013.
This is counterintuitive based on the fact that the S&P 500 gained an impressive 13.7% on the year in 2014. Interestingly, only about half of the managers beat the index’s performance, with the rest falling into single-digit return territory.
Minimum Wage
The minimum amount of earnings to make the list dropped significantly from $300 million to $175 million. This is the lowest minimum earnings in the last three years.
David Tepper, of Appaloosa Management, is barely staying afloat. After having one of the best five-year stretches of performance in hedge fund history, he saw his earnings decline 88.6% in 2014. He had finished #1 overall in 2013, but only saw a 2.2% gain over the last year.
Many managers were not even lucky enough to get the “minimum wage”.
John Paulson of Paulson & Co., who famously made his fortune betting against the US Housing Market in 2007, ended up tanking in 2014 with his second worst year ever. His Advantage Plus fund fell 36% while his Advantage fund dropped 29%.
The Top 10 Investors
The managers that had the highest returns were as follows:
10. Charles (Chase) Coleman III of Tiger Global Management – $425 million
9. O. Andreas Halvorsen of Viking Global Investors – $450 million
8. David Shaw of D.E. Shaw Group – $530 million
7. Larry Robbins of Glenview Capital Management – $570 million
6. Michael Platt of BlueCrest Capital Management – $800 million
5. Israel (Izzy) Englander of Millennium Management – $900 million
4. Bill Ackman of Pershing Square Capital Management – $950 million
3. Ray Dalio of Bridgewater Associates – $1.1 billion
2. James Simons of Renaissance Technologies – $1.2 billion
1. Kenneth Griffin of Citadel – $1.3 billion
Profiles on those that broke $1 billion:
Ray Dalio, the legendary founder of Bridgewater Associates, along with two of his associates, made the full list of 25 earners. Bridgewater uses computers and humans to make decisions in 199 markets. Ray took home $1.1 billion.
Renaissance’s intense data focus helped James Simons qualify to the Rich List every year for the last 14 years. He finished #2 with $1.2 billion in earnings.
Kenneth Griffin has made the Rich List 13 times, however this is his first time finishing #1 overall. The founder and CEO of Citadel posted gains of 18.3% in its multistrategy funds driven largely by profits related to the equity markets.
What’s Ahead for 2015?
While 2014 was a tumultuous year for hedge fund managers, it is clear 2015 will be at least as challenging and interesting. Global headwinds such as the Greek Crisis and volatile Chinese equity markets will test even the most seasoned investors.


Markets
The European Stock Market: Attractive Valuations Offer Opportunities
On average, the European stock market has valuations that are nearly 50% lower than U.S. valuations. But how can you access the market?


European Stock Market: Attractive Valuations Offer Opportunities
Europe is known for some established brands, from L’Oréal to Louis Vuitton. However, the European stock market offers additional opportunities that may be lesser known.
The above infographic, sponsored by STOXX, outlines why investors may want to consider European stocks.
Attractive Valuations
Compared to most North American and Asian markets, European stocks offer lower or comparable valuations.
| Index | Price-to-Earnings Ratio | Price-to-Book Ratio |
|---|---|---|
| EURO STOXX 50 | 14.9 | 2.2 |
| STOXX Europe 600 | 14.4 | 2 |
| U.S. | 25.9 | 4.7 |
| Canada | 16.1 | 1.8 |
| Japan | 15.4 | 1.6 |
| Asia Pacific ex. China | 17.1 | 1.8 |
Data as of February 29, 2024. See graphic for full index names. Ratios based on trailing 12 month financials. The price to earnings ratio excludes companies with negative earnings.
On average, European valuations are nearly 50% lower than U.S. valuations, potentially offering an affordable entry point for investors.
Research also shows that lower price ratios have historically led to higher long-term returns.
Market Movements Not Closely Connected
Over the last decade, the European stock market had low-to-moderate correlation with North American and Asian equities.
The below chart shows correlations from February 2014 to February 2024. A value closer to zero indicates low correlation, while a value of one would indicate that two regions are moving in perfect unison.
| EURO STOXX 50 | STOXX EUROPE 600 | U.S. | Canada | Japan | Asia Pacific ex. China |
|
|---|---|---|---|---|---|---|
| EURO STOXX 50 | 1.00 | 0.97 | 0.55 | 0.67 | 0.24 | 0.43 |
| STOXX EUROPE 600 | 1.00 | 0.56 | 0.71 | 0.28 | 0.48 | |
| U.S. | 1.00 | 0.73 | 0.12 | 0.25 | ||
| Canada | 1.00 | 0.22 | 0.40 | |||
| Japan | 1.00 | 0.88 | ||||
| Asia Pacific ex. China | 1.00 |
Data is based on daily USD returns.
European equities had relatively independent market movements from North American and Asian markets. One contributing factor could be the differing sector weights in each market. For instance, technology makes up a quarter of the U.S. market, but health care and industrials dominate the broader European market.
Ultimately, European equities can enhance portfolio diversification and have the potential to mitigate risk for investors.
Tracking the Market
For investors interested in European equities, STOXX offers a variety of flagship indices:
| Index | Description | Market Cap |
|---|---|---|
| STOXX Europe 600 | Pan-regional, broad market | €10.5T |
| STOXX Developed Europe | Pan-regional, broad-market | €9.9T |
| STOXX Europe 600 ESG-X | Pan-regional, broad market, sustainability focus | €9.7T |
| STOXX Europe 50 | Pan-regional, blue-chip | €5.1T |
| EURO STOXX 50 | Eurozone, blue-chip | €3.5T |
Data is as of February 29, 2024. Market cap is free float, which represents the shares that are readily available for public trading on stock exchanges.
The EURO STOXX 50 tracks the Eurozone’s biggest and most traded companies. It also underlies one of the world’s largest ranges of ETFs and mutual funds. As of November 2023, there were €27.3 billion in ETFs and €23.5B in mutual fund assets under management tracking the index.
“For the past 25 years, the EURO STOXX 50 has served as an accurate, reliable and tradable representation of the Eurozone equity market.”
— Axel Lomholt, General Manager at STOXX
Partnering with STOXX to Track the European Stock Market
Are you interested in European equities? STOXX can be a valuable partner:
- Comprehensive, liquid and investable ecosystem
- European heritage, global reach
- Highly sophisticated customization capabilities
- Open architecture approach to using data
- Close partnerships with clients
- Part of ISS STOXX and Deutsche Börse Group
With a full suite of indices, STOXX can help you benchmark against the European stock market.
Learn how STOXX’s European indices offer liquid and effective market access.

-

 Economy1 day ago
Economic Growth Forecasts for G7 and BRICS Countries in 2024
The IMF has released its economic growth forecasts for 2024. How do the G7 and BRICS countries compare?
-

 Markets1 week ago
U.S. Debt Interest Payments Reach $1 Trillion
U.S. debt interest payments have surged past the $1 trillion dollar mark, amid high interest rates and an ever-expanding debt burden.
-

 United States2 weeks ago
Ranked: The Largest U.S. Corporations by Number of Employees
We visualized the top U.S. companies by employees, revealing the massive scale of retailers like Walmart, Target, and Home Depot.
-

 Markets2 weeks ago
The Top 10 States by Real GDP Growth in 2023
This graphic shows the states with the highest real GDP growth rate in 2023, largely propelled by the oil and gas boom.
-

 Markets2 weeks ago
Ranked: The World’s Top Flight Routes, by Revenue
In this graphic, we show the highest earning flight routes globally as air travel continued to rebound in 2023.
-

 Markets2 weeks ago
Ranked: The Most Valuable Housing Markets in America
The U.S. residential real estate market is worth a staggering $47.5 trillion. Here are the most valuable housing markets in the country.


-

 Mining1 week ago
Gold vs. S&P 500: Which Has Grown More Over Five Years?
-
Markets2 weeks ago
Ranked: The Most Valuable Housing Markets in America
-

 Money2 weeks ago
Which States Have the Highest Minimum Wage in America?
-

 AI2 weeks ago
Ranked: Semiconductor Companies by Industry Revenue Share
-
Markets2 weeks ago
Ranked: The World’s Top Flight Routes, by Revenue
-

 Demographics2 weeks ago
Population Projections: The World’s 6 Largest Countries in 2075
-
Markets2 weeks ago
The Top 10 States by Real GDP Growth in 2023
-

 Demographics2 weeks ago
The Smallest Gender Wage Gaps in OECD Countries